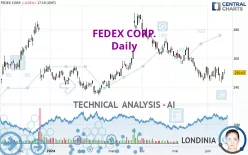
FEDEX CORP. - Daily - Technical analysis published on 06/18/2024 (GMT)
- 392
- 0
Click here for a new analysis!
- Timeframe : Daily
- - Analysis generated on
- Status : INVALID

Summary of the analysis

Additional analysis
Quotes
The FEDEX CORP. rating is 250.03 USD. On the day, this instrument lost -0.01% with the lowest point at 249.12 USD and the highest point at 252.41 USD. The deviation from the price is +0.37% for the low point and -0.94% for the high point.The Central Gaps scanner detects a bullish opening. A small advantage for buyers in the very short term.
Bullish opening
Type : Bullish
Timeframe : Openning
So that you have an overall view of the price change, here is a table showing the variations over several periods:
Near a new HIGH record (1 month)
Type : Bullish
Timeframe : Weekly
Technical
Technical analysis of this Daily chart of FEDEX CORP. indicates that the overall trend is strongly bearish. The signals given by moving averages are 82.14% bearish. This strongly bearish trend seems to be slowing down given the slightly bearish signals being given by short-term moving averages. The Central Indicators market scanner is currently detecting a bearish signal that could impact this trend:
Moving Average bearish crossovers : AMA50 & AMA100
Type : Bearish
Timeframe : Daily
In fact, according to the parameters integrated into the Central Analyzer system, only 9 technical indicators out of 18 analysed are currently bullish. Central Indicators, the detector scanner for these technical indicators has recently detected several signals:
Price is back over the pivot point
Type : Bullish
Timeframe : Weekly
Momentum indicator is back under 0
Type : Bearish
Timeframe : Daily
Central Patterns, the market scanner focusing on chart patterns, resistances and supports found this result:
Near horizontal resistance
Type : Bearish
Timeframe : Daily
Central Candlesticks, the scanner specialised in Japanese candlesticks, detects a bearish signal that could support the hypothesis of a small drop in the very short term:
Black gravestone / inverted hammer
Type : Bearish
Timeframe : Daily
| S3 | S2 | S1 | Price | R1 | R2 | R3 | |
|---|---|---|---|---|---|---|---|
| ProTrendLines | 235.29 | 240.19 | 249.97 | 250.03 | 266.01 | 280.50 | 289.74 |
| Change (%) | -5.90% | -3.94% | -0.02% | - | +6.39% | +12.19% | +15.88% |
| Change | -14.74 | -9.84 | -0.06 | - | +15.98 | +30.47 | +39.71 |
| Level | Major | Minor | Major | - | Intermediate | Intermediate | Intermediate |
Attention could also be paid to pivot points to set price objectives:
| Pivot points | S3 | S2 | S1 | PP | R1 | R2 | R3 |
|---|---|---|---|---|---|---|---|
| Standard | 240.83 | 242.84 | 246.45 | 248.46 | 252.07 | 254.08 | 257.69 |
| Camarilla | 248.52 | 249.03 | 249.55 | 250.06 | 250.58 | 251.09 | 251.61 |
| Woodie | 241.63 | 243.24 | 247.25 | 248.86 | 252.87 | 254.48 | 258.49 |
| Fibonacci | 242.84 | 244.99 | 246.31 | 248.46 | 250.61 | 251.93 | 254.08 |
| Pivot points | S3 | S2 | S1 | PP | R1 | R2 | R3 |
|---|---|---|---|---|---|---|---|
| Standard | 230.09 | 236.50 | 241.47 | 247.88 | 252.85 | 259.26 | 264.23 |
| Camarilla | 243.30 | 244.34 | 245.39 | 246.43 | 247.47 | 248.52 | 249.56 |
| Woodie | 229.36 | 236.14 | 240.74 | 247.52 | 252.12 | 258.90 | 263.50 |
| Fibonacci | 236.50 | 240.85 | 243.54 | 247.88 | 252.23 | 254.92 | 259.26 |
| Pivot points | S3 | S2 | S1 | PP | R1 | R2 | R3 |
|---|---|---|---|---|---|---|---|
| Standard | 218.72 | 231.51 | 242.74 | 255.53 | 266.76 | 279.55 | 290.78 |
| Camarilla | 247.36 | 249.56 | 251.76 | 253.96 | 256.16 | 258.36 | 260.57 |
| Woodie | 217.93 | 231.12 | 241.95 | 255.14 | 265.97 | 279.16 | 289.99 |
| Fibonacci | 231.51 | 240.69 | 246.36 | 255.53 | 264.71 | 270.38 | 279.55 |
Numerical data
The following is the status of technical indicators and moving averages registered at the time this technical analysis was created:
| RSI (14): | 46.00 | |
| MACD (12,26,9): | -2.4200 | |
| Directional Movement: | -1.46 | |
| AROON (14): | -71.42 | |
| DEMA (21): | 247.38 | |
| Parabolic SAR (0,02-0,02-0,2): | 253.41 | |
| Elder Ray (13): | 1.14 | |
| Super Trend (3,10): | 257.82 | |
| Zig ZAG (10): | 249.51 | |
| VORTEX (21): | 0.8900 | |
| Stochastique (14,3,5): | 50.14 | |
| TEMA (21): | 247.51 | |
| Williams %R (14): | -43.11 | |
| Chande Momentum Oscillator (20): | -4.56 | |
| Repulse (5,40,3): | 0.9900 | |
| ROCnROLL: | 2 | |
| TRIX (15,9): | -0.1800 | |
| Courbe Coppock: | 0.26 |
| MA7: | 249.86 | |
| MA20: | 249.41 | |
| MA50: | 258.24 | |
| MA100: | 255.74 | |
| MAexp7: | 249.20 | |
| MAexp20: | 251.03 | |
| MAexp50: | 255.05 | |
| MAexp100: | 255.88 | |
| Price / MA7: | +0.07% | |
| Price / MA20: | +0.25% | |
| Price / MA50: | -3.18% | |
| Price / MA100: | -2.23% | |
| Price / MAexp7: | +0.33% | |
| Price / MAexp20: | -0.40% | |
| Price / MAexp50: | -1.97% | |
| Price / MAexp100: | -2.29% |
News
The latest news and videos published on FEDEX CORP. at the time of the analysis were as follows:
- Electrification 101: How Fleets and Utilities Can Work Together To Unlock Electrified Transportation
- FedEx Awards More Than $230,000 to 10 Small Businesses
- Flooding in Southern Brazil
- The 2023 FedEx Cares Report Is Now Available
- These Paintings Are No Joke - Art by Talented Chimps on Display in New York
About author
Online


Add a comment
Comments
0 comments on the analysis FEDEX CORP. - Daily