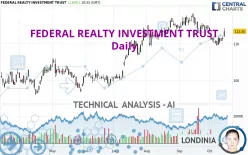
FEDERAL REALTY INVESTMENT TRUST - Daily - Technical analysis published on 10/15/2024 (GMT)
- 97
- 0
Click here for a new analysis!
- Timeframe : Daily
- - Analysis generated on
- Status : TARGET REACHED

Summary of the analysis

Additional analysis
Quotes
FEDERAL REALTY INVESTMENT TRUST rating 113.35 USD. The price has increased by +1.63% since the last closing and was traded between 111.89 USD and 114.18 USD over the period. The price is currently at +1.30% from its lowest and -0.73% from its highest.The Central Gaps scanner detects a bullish opening marking the presence of buyers ahead of sellers at the opening but not sufficiently marked to allow the price to register a quotation gap.
Bullish opening
Type : Bullish
Timeframe : Openning
Here is a more detailed summary of the historical variations registered by FEDERAL REALTY INVESTMENT TRUST:
Near a new HIGH record (1 year)
Type : Bullish
Timeframe : Weekly
Near a new HIGH record (1st january)
Type : Bullish
Timeframe : Weekly
Near a new LOW record (1 month)
Type : Bearish
Timeframe : Weekly
Technical
Technical analysis of FEDERAL REALTY INVESTMENT TRUST in Daily shows a strongly overall bullish trend. 85.71% of the signals given by moving averages are bullish. The slightly bullish signals given by the short-term moving averages indicate this trend is showing signs of running out of steam. The Central Indicators scanner detects bullish signals on moving averages that could impact this trend:
Bullish trend reversal : Moving Average 50
Type : Bullish
Timeframe : Daily
Bullish trend reversal : adaptative moving average 50
Type : Bullish
Timeframe : Daily
Bullish price crossover with Moving Average 20
Type : Bullish
Timeframe : Daily
Bullish price crossover with Moving Average 50
Type : Bullish
Timeframe : Daily
Bullish price crossover with adaptative moving average 20
Type : Bullish
Timeframe : Daily
Bullish price crossover with adaptative moving average 50
Type : Bullish
Timeframe : Daily
The technical indicators are bullish. There is still some doubt about the price increase.
Other results related to technical indicators were also found by the Central Indicators scanner:
Pivot points : price is over resistance 1
Type : Neutral
Timeframe : Weekly
Pivot points : price is over resistance 2
Type : Neutral
Timeframe : Daily
RSI indicator is back over 50
Type : Bullish
Timeframe : Daily
Ichimoku : price is over the cloud
Type : Bullish
Timeframe : Daily
Momentum indicator is back over 0
Type : Bullish
Timeframe : Daily
Williams %R indicator is back over -50
Type : Bullish
Timeframe : Daily
Central Patterns, the market scanner focusing on chart patterns, resistances and supports found these results:
Near horizontal resistance
Type : Bearish
Timeframe : Daily
Resistance of channel is broken
Type : Bullish
Timeframe : Daily
The Central Candlesticks scanner, specialised in Japanese candlesticks, did not identify any signals.
| S3 | S2 | S1 | Price | R1 | R2 | R3 | |
|---|---|---|---|---|---|---|---|
| ProTrendLines | 95.79 | 100.07 | 103.05 | 113.35 | 113.87 | 115.88 | 126.42 |
| Change (%) | -15.49% | -11.72% | -9.09% | - | +0.46% | +2.23% | +11.53% |
| Change | -17.56 | -13.28 | -10.30 | - | +0.52 | +2.53 | +13.07 |
| Level | Intermediate | Intermediate | Major | - | Intermediate | Major | Major |
Attention could also be paid to pivot points to set price objectives:
| Pivot points | S3 | S2 | S1 | PP | R1 | R2 | R3 |
|---|---|---|---|---|---|---|---|
| Standard | 109.36 | 110.00 | 110.77 | 111.41 | 112.18 | 112.82 | 113.59 |
| Camarilla | 111.14 | 111.27 | 111.40 | 111.53 | 111.66 | 111.79 | 111.92 |
| Woodie | 109.42 | 110.03 | 110.83 | 111.44 | 112.24 | 112.85 | 113.65 |
| Fibonacci | 110.00 | 110.54 | 110.88 | 111.41 | 111.95 | 112.29 | 112.82 |
| Pivot points | S3 | S2 | S1 | PP | R1 | R2 | R3 |
|---|---|---|---|---|---|---|---|
| Standard | 107.46 | 108.44 | 109.94 | 110.92 | 112.42 | 113.40 | 114.90 |
| Camarilla | 110.77 | 111.00 | 111.22 | 111.45 | 111.68 | 111.91 | 112.13 |
| Woodie | 107.73 | 108.57 | 110.21 | 111.05 | 112.69 | 113.53 | 115.17 |
| Fibonacci | 108.44 | 109.38 | 109.97 | 110.92 | 111.86 | 112.45 | 113.40 |
| Pivot points | S3 | S2 | S1 | PP | R1 | R2 | R3 |
|---|---|---|---|---|---|---|---|
| Standard | 105.92 | 108.84 | 111.36 | 114.28 | 116.80 | 119.72 | 122.24 |
| Camarilla | 112.37 | 112.87 | 113.37 | 113.87 | 114.37 | 114.87 | 115.37 |
| Woodie | 105.71 | 108.74 | 111.15 | 114.18 | 116.59 | 119.62 | 122.03 |
| Fibonacci | 108.84 | 110.92 | 112.21 | 114.28 | 116.36 | 117.65 | 119.72 |
Numerical data
The following is the status of the technical indicators and moving averages at the time of publication of this technical analysis:
| RSI (14): | 55.94 | |
| MACD (12,26,9): | -0.3900 | |
| Directional Movement: | 4.97 | |
| AROON (14): | -35.72 | |
| DEMA (21): | 111.82 | |
| Parabolic SAR (0,02-0,02-0,2): | 109.46 | |
| Elder Ray (13): | 1.03 | |
| Super Trend (3,10): | 114.99 | |
| Zig ZAG (10): | 113.83 | |
| VORTEX (21): | 0.8300 | |
| Stochastique (14,3,5): | 56.81 | |
| TEMA (21): | 111.02 | |
| Williams %R (14): | -12.15 | |
| Chande Momentum Oscillator (20): | 0.53 | |
| Repulse (5,40,3): | 2.3700 | |
| ROCnROLL: | 1 | |
| TRIX (15,9): | -0.0600 | |
| Courbe Coppock: | 3.64 |
| MA7: | 111.25 | |
| MA20: | 112.33 | |
| MA50: | 112.96 | |
| MA100: | 107.63 | |
| MAexp7: | 111.91 | |
| MAexp20: | 112.26 | |
| MAexp50: | 111.62 | |
| MAexp100: | 108.68 | |
| Price / MA7: | +1.89% | |
| Price / MA20: | +0.91% | |
| Price / MA50: | +0.35% | |
| Price / MA100: | +5.31% | |
| Price / MAexp7: | +1.29% | |
| Price / MAexp20: | +0.97% | |
| Price / MAexp50: | +1.55% | |
| Price / MAexp100: | +4.30% |
News
Don't forget to follow the news on FEDERAL REALTY INVESTMENT TRUST. At the time of publication of this analysis, the latest news was as follows:
- Federal Realty Investment Trust Earns Dual Top Workplace Honors from The Washington Post and San Francisco Chronicle
- Federal Realty Investment Trust Announces Third Quarter 2024 Earnings Release Date and Conference Call Information
- Federal Realty to Present at BofA Securities 2024 Global Real Estate Conference
- Federal Realty Investment Trust Announces Second Quarter 2024 Operating Results
- Federal Realty Investment Trust Completes Sale of Third Street Promenade Portfolio
About author

Online


Add a comment
Comments
0 comments on the analysis FEDERAL REALTY INVESTMENT TRUST - Daily