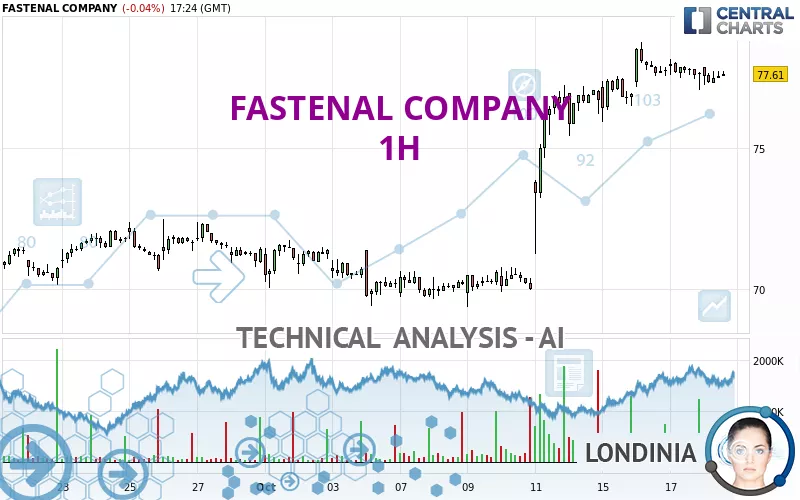
FASTENAL COMPANY - 1H - Technical analysis published on 10/18/2024 (GMT)
- 174
- 0
Click here for a new analysis!
- Timeframe : 1H
- - Analysis generated on
- Status : LEVEL MAINTAINED

Summary of the analysis

Additional analysis
Quotes
The FASTENAL COMPANY price is 77.61 USD. On the day, this instrument lost -0.04% and was between 77.24 USD and 77.87 USD. This implies that the price is at +0.48% from its lowest and at -0.33% from its highest.A bullish opening was detected by the Central Gaps scanner. Buyers are trying to impose a bullish momentum in the very short term.
Bullish opening
Type : Bullish
Timeframe : Openning
So that you have an overall view of the price change, here is a table showing the variations over several periods:
New HIGH record (5 years)
Type : Bullish
Timeframe : Weekly
Near a new HIGH record (1 year)
Type : Bullish
Timeframe : Weekly
Near a new HIGH record (1st january)
Type : Bullish
Timeframe : Weekly
Near a new HIGH record (1 month)
Type : Bullish
Timeframe : Weekly
Technical
Technical analysis of this 1H chart of FASTENAL COMPANY indicates that the overall trend is strongly bullish. 85.71% of the signals given by moving averages are bullish. The slightly bullish signals given by the short-term moving averages show a weakening of the global trend. The Central Indicators market scanner currently does not detect any result that concerns moving averages.
An assessment of technical indicators does not currently provide any relevant information to suggest whether the signal given by the technical indicators is more bullish or bearish.
Central Indicators, the detector scanner for these technical indicators has recently detected several signals:
Price is back over the pivot point
Type : Bullish
Timeframe : 1 hour
Williams %R indicator is back over -50
Type : Bullish
Timeframe : 1 hour
Central Patterns, the market scanner focusing on chart patterns, resistances and supports found these results:
Near horizontal support
Type : Bullish
Timeframe : 1 hour
Support of channel is broken
Type : Bearish
Timeframe : 1 hour
No result was found by the Central Candlesticks scanner on Japanese candlesticks.
| S3 | S2 | S1 | Price | R1 | |
|---|---|---|---|---|---|
| ProTrendLines | 70.89 | 72.45 | 77.53 | 77.61 | 78.75 |
| Change (%) | -8.66% | -6.65% | -0.10% | - | +1.47% |
| Change | -6.72 | -5.16 | -0.08 | - | +1.14 |
| Level | Major | Intermediate | Major | - | Intermediate |
To determine price objectives, it is also possible to use the pivot points. Here is the price position in relation to pivot points:
| Pivot points | S3 | S2 | S1 | PP | R1 | R2 | R3 |
|---|---|---|---|---|---|---|---|
| Standard | 75.96 | 76.51 | 77.07 | 77.62 | 78.18 | 78.73 | 79.29 |
| Camarilla | 77.34 | 77.44 | 77.54 | 77.64 | 77.74 | 77.84 | 77.95 |
| Woodie | 75.98 | 76.51 | 77.09 | 77.62 | 78.20 | 78.73 | 79.31 |
| Fibonacci | 76.51 | 76.93 | 77.19 | 77.62 | 78.04 | 78.30 | 78.73 |
| Pivot points | S3 | S2 | S1 | PP | R1 | R2 | R3 |
|---|---|---|---|---|---|---|---|
| Standard | 63.86 | 66.61 | 71.72 | 74.47 | 79.58 | 82.33 | 87.44 |
| Camarilla | 74.66 | 75.38 | 76.10 | 76.82 | 77.54 | 78.26 | 78.98 |
| Woodie | 65.03 | 67.20 | 72.89 | 75.06 | 80.75 | 82.92 | 88.61 |
| Fibonacci | 66.61 | 69.62 | 71.47 | 74.47 | 77.48 | 79.33 | 82.33 |
| Pivot points | S3 | S2 | S1 | PP | R1 | R2 | R3 |
|---|---|---|---|---|---|---|---|
| Standard | 57.78 | 60.93 | 66.18 | 69.33 | 74.58 | 77.73 | 82.98 |
| Camarilla | 69.11 | 69.88 | 70.65 | 71.42 | 72.19 | 72.96 | 73.73 |
| Woodie | 58.82 | 61.46 | 67.22 | 69.86 | 75.62 | 78.26 | 84.02 |
| Fibonacci | 60.93 | 64.14 | 66.13 | 69.33 | 72.54 | 74.53 | 77.73 |
Numerical data
The following is the status of technical indicators and moving averages registered at the time this technical analysis was created:
| RSI (14): | 57.67 | |
| MACD (12,26,9): | 0.4400 | |
| Directional Movement: | 4.21 | |
| AROON (14): | -42.86 | |
| DEMA (21): | 78.14 | |
| Parabolic SAR (0,02-0,02-0,2): | 78.28 | |
| Elder Ray (13): | 0.05 | |
| Super Trend (3,10): | 76.22 | |
| Zig ZAG (10): | 77.56 | |
| VORTEX (21): | 1.0100 | |
| Stochastique (14,3,5): | 36.94 | |
| TEMA (21): | 77.64 | |
| Williams %R (14): | -51.35 | |
| Chande Momentum Oscillator (20): | -0.13 | |
| Repulse (5,40,3): | -0.1300 | |
| ROCnROLL: | 1 | |
| TRIX (15,9): | 0.1200 | |
| Courbe Coppock: | 0.34 |
| MA7: | 76.20 | |
| MA20: | 72.82 | |
| MA50: | 69.88 | |
| MA100: | 67.60 | |
| MAexp7: | 77.56 | |
| MAexp20: | 77.39 | |
| MAexp50: | 75.89 | |
| MAexp100: | 74.10 | |
| Price / MA7: | +1.85% | |
| Price / MA20: | +6.58% | |
| Price / MA50: | +11.06% | |
| Price / MA100: | +14.81% | |
| Price / MAexp7: | +0.06% | |
| Price / MAexp20: | +0.28% | |
| Price / MAexp50: | +2.27% | |
| Price / MAexp100: | +4.74% |
News
Don't forget to follow the news on FASTENAL COMPANY. At the time of publication of this analysis, the latest news was as follows:
- Fastenal Company Reports 2023 First Quarter Earnings
- Fastenal Company Announces Cash Dividend
- Fastenal Company Announces Conference Call to Review 2023 First Quarter Earnings
- Fastenal Names New Executive VP of Human Resources
- Fastenal Company Reports 2022 Annual and Fourth Quarter Earnings
About author
Online


Add a comment
Comments
0 comments on the analysis FASTENAL COMPANY - 1H