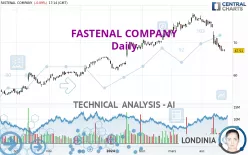
FASTENAL COMPANY - Daily - Technical analysis published on 04/22/2024 (GMT)
- 178
- 0
Click here for a new analysis!
- Timeframe : Daily
- - Analysis generated on
- Status : LEVEL MAINTAINED

Summary of the analysis

Additional analysis
Quotes
The FASTENAL COMPANY rating is 67.51 USD. The price registered a decrease of -0.09% on the session and was traded between 67.20 USD and 67.95 USD over the period. The price is currently at +0.46% from its lowest and -0.65% from its highest.The Central Gaps scanner detects a bullish opening marking the presence of buyers ahead of sellers at the opening but not sufficiently marked to allow the price to register a quotation gap.
Bullish opening
Type : Bullish
Timeframe : Openning
So that you have an overall view of the price change, here is a table showing the variations over several periods:
New LOW record (1 month)
Type : Bearish
Timeframe : Weekly
Technical
Technical analysis of this Daily chart of FASTENAL COMPANY indicates that the overall trend is bearish. 67.86% of the signals given by moving averages are bearish. This bearish trend is supported by the strong bearish signals given by short-term moving averages. An assessment of moving averages reveals a bearish signal that could impact this trend:
Moving Average bearish crossovers : MA20 & MA50
Type : Bearish
Timeframe : Daily
In fact, 13 technical indicators on 18 studied are currently bearish. But beware of excesses. The Central Indicators scanner currently detects this:
RSI indicator is oversold : under 30
Type : Neutral
Timeframe : Daily
CCI indicator is oversold : under -100
Type : Neutral
Timeframe : Daily
Williams %R indicator is oversold : under -80
Type : Neutral
Timeframe : Daily
Price is back under the pivot point
Type : Bearish
Timeframe : Daily
An analysis of the price chart with the Central Patterns scanner (detector of chart patterns and resistances and supports) shows several results that can have an impact on the price change:
Near horizontal support
Type : Bullish
Timeframe : Daily
Support of channel is broken
Type : Bearish
Timeframe : Daily
No result was found by the Central Candlesticks scanner on Japanese candlesticks.
| S3 | S2 | S1 | Price | R1 | R2 | R3 | |
|---|---|---|---|---|---|---|---|
| ProTrendLines | 57.59 | 60.96 | 65.08 | 67.51 | 68.01 | 70.65 | 75.15 |
| Change (%) | -14.69% | -9.70% | -3.60% | - | +0.74% | +4.65% | +11.32% |
| Change | -9.92 | -6.55 | -2.43 | - | +0.50 | +3.14 | +7.64 |
| Level | Major | Major | Minor | - | Intermediate | Minor | Major |
Attention could also be paid to pivot points to set price objectives:
| Pivot points | S3 | S2 | S1 | PP | R1 | R2 | R3 |
|---|---|---|---|---|---|---|---|
| Standard | 66.40 | 66.84 | 67.21 | 67.65 | 68.02 | 68.46 | 68.83 |
| Camarilla | 67.35 | 67.42 | 67.50 | 67.57 | 67.64 | 67.72 | 67.79 |
| Woodie | 66.36 | 66.82 | 67.17 | 67.63 | 67.98 | 68.44 | 68.79 |
| Fibonacci | 66.84 | 67.15 | 67.34 | 67.65 | 67.96 | 68.15 | 68.46 |
| Pivot points | S3 | S2 | S1 | PP | R1 | R2 | R3 |
|---|---|---|---|---|---|---|---|
| Standard | 61.90 | 64.60 | 66.08 | 68.78 | 70.26 | 72.96 | 74.44 |
| Camarilla | 66.42 | 66.80 | 67.19 | 67.57 | 67.95 | 68.34 | 68.72 |
| Woodie | 61.30 | 64.30 | 65.48 | 68.48 | 69.66 | 72.66 | 73.84 |
| Fibonacci | 64.60 | 66.19 | 67.18 | 68.78 | 70.37 | 71.36 | 72.96 |
| Pivot points | S3 | S2 | S1 | PP | R1 | R2 | R3 |
|---|---|---|---|---|---|---|---|
| Standard | 66.21 | 69.15 | 73.15 | 76.09 | 80.09 | 83.03 | 87.03 |
| Camarilla | 75.23 | 75.87 | 76.50 | 77.14 | 77.78 | 78.41 | 79.05 |
| Woodie | 66.73 | 69.42 | 73.67 | 76.36 | 80.61 | 83.30 | 87.55 |
| Fibonacci | 69.15 | 71.80 | 73.44 | 76.09 | 78.74 | 80.38 | 83.03 |
Numerical data
The following is the status of the technical indicators and moving averages at the time of publication of this technical analysis:
| RSI (14): | 25.76 | |
| MACD (12,26,9): | -1.9000 | |
| Directional Movement: | -23.08 | |
| AROON (14): | -85.71 | |
| DEMA (21): | 69.82 | |
| Parabolic SAR (0,02-0,02-0,2): | 71.55 | |
| Elder Ray (13): | -3.01 | |
| Super Trend (3,10): | 72.05 | |
| Zig ZAG (10): | 67.49 | |
| VORTEX (21): | 0.6700 | |
| Stochastique (14,3,5): | 2.40 | |
| TEMA (21): | 67.42 | |
| Williams %R (14): | -97.08 | |
| Chande Momentum Oscillator (20): | -7.68 | |
| Repulse (5,40,3): | -3.2700 | |
| ROCnROLL: | 2 | |
| TRIX (15,9): | -0.1800 | |
| Courbe Coppock: | 20.92 |
| MA7: | 68.52 | |
| MA20: | 73.27 | |
| MA50: | 73.42 | |
| MA100: | 69.06 | |
| MAexp7: | 68.87 | |
| MAexp20: | 71.75 | |
| MAexp50: | 72.05 | |
| MAexp100: | 69.27 | |
| Price / MA7: | -1.47% | |
| Price / MA20: | -7.86% | |
| Price / MA50: | -8.05% | |
| Price / MA100: | -2.24% | |
| Price / MAexp7: | -1.97% | |
| Price / MAexp20: | -5.91% | |
| Price / MAexp50: | -6.30% | |
| Price / MAexp100: | -2.54% |
News
Don't forget to follow the news on FASTENAL COMPANY. At the time of publication of this analysis, the latest news was as follows:
- Fastenal Company Reports 2023 First Quarter Earnings
- Fastenal Company Announces Cash Dividend
- Fastenal Company Announces Conference Call to Review 2023 First Quarter Earnings
- Fastenal Names New Executive VP of Human Resources
- Fastenal Company Reports 2022 Annual and Fourth Quarter Earnings
About author
Online


Add a comment
Comments
0 comments on the analysis FASTENAL COMPANY - Daily