| Open: | - |
| Change: | - |
| Volume: | - |
| Low: | - |
| High: | - |
| High / Low range: | - |
| Type: | Stocks |
| Ticker: | GEBN |
| ISIN: | CH0030170408 |
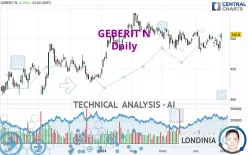
GEBERIT N - Daily - Technical analysis published on 04/28/2023 (GMT)
- 185
- 0
- 04/28/2023 - 17:35
Click here for a new analysis!
- Timeframe : Daily
- - Analysis generated on 04/28/2023 - 17:35
- Status : INVALID

Summary of the analysis

Additional analysis
Quotes
The GEBERIT N price is 506.8000 CHF. On the day, this instrument gained +2.20% and was traded between 496.7000 CHF and 509.2000 CHF over the period. The price is currently at +2.03% from its lowest and -0.47% from its highest.The Central Gaps scanner detects the formation of a bullish gap marking the strong presence of buyers against sellers at the opening. This formed a quotation gap.
Opening Gap UP
Type : Bullish
Timeframe : Openning
Here is a more detailed summary of the historical variations registered by GEBERIT N:
Near a new LOW record (1 month)
Type : Bearish
Timeframe : Weekly
Technical
A technical analysis in Daily of this GEBERIT N chart shows a bullish trend. 78.57% of the signals given by moving averages are bullish. This bullish trend is supported by the strong bullish signals given by short-term moving averages. The Central Indicators market scanner is currently detecting several bullish signals that could impact this trend:
Bullish trend reversal : adaptative moving average 20
Type : Bullish
Timeframe : Daily
Bullish trend reversal : adaptative moving average 100
Type : Bullish
Timeframe : Daily
Bullish price crossover with Moving Average 50
Type : Bullish
Timeframe : Daily
Bullish price crossover with adaptative moving average 20
Type : Bullish
Timeframe : Daily
Bullish price crossover with adaptative moving average 50
Type : Bullish
Timeframe : Daily
The probability of a further increase is high given the direction of the technical indicators.
But beware of excesses. The Central Indicators scanner currently detects this:
Williams %R indicator is overbought : over -20
Type : Neutral
Timeframe : Daily
Pivot points : price is over resistance 1
Type : Neutral
Timeframe : Weekly
Pivot points : price is over resistance 2
Type : Neutral
Timeframe : Daily
RSI indicator is back over 50
Type : Bullish
Timeframe : Daily
MACD crosses UP its Moving Average
Type : Bullish
Timeframe : Daily
Parabolic SAR indicator bullish reversal
Type : Bullish
Timeframe : Daily
Central Patterns, the market scanner focusing on chart patterns, resistances and supports found these results:
Near horizontal resistance
Type : Bearish
Timeframe : Daily
Resistance of channel is broken
Type : Bullish
Timeframe : Daily
Resistance of triangle is broken
Type : Bullish
Timeframe : Daily
For a small rebound in the very short term, the Central Candlesticks scanner currently notes the presence of this bullish pattern in Japanese candlesticks:
Upside gap
Type : Bullish
Timeframe : Daily
| S3 | S2 | S1 | Price | R1 | R2 | R3 | |
|---|---|---|---|---|---|---|---|
| ProTrendLines | 446.6580 | 463.0000 | 492.0190 | 506.8000 | 510.1850 | 520.2000 | 535.3300 |
| Change (%) | -11.87% | -8.64% | -2.92% | - | +0.67% | +2.64% | +5.63% |
| Change | -60.1420 | -43.8000 | -14.7810 | - | +3.3850 | +13.4000 | +28.5300 |
| Level | Major | Minor | Major | - | Major | Minor | Major |
To determine price objectives, it is also possible to use the pivot points. Here is the price position in relation to pivot points:
| Pivot points | S3 | S2 | S1 | PP | R1 | R2 | R3 |
|---|---|---|---|---|---|---|---|
| Standard | 486.7667 | 491.7333 | 499.2667 | 504.2333 | 511.7667 | 516.7333 | 524.2667 |
| Camarilla | 503.3625 | 504.5083 | 505.6542 | 506.8000 | 507.9458 | 509.0917 | 510.2375 |
| Woodie | 488.0500 | 492.3750 | 500.5500 | 504.8750 | 513.0500 | 517.3750 | 525.5500 |
| Fibonacci | 491.7333 | 496.5083 | 499.4583 | 504.2333 | 509.0083 | 511.9583 | 516.7333 |
| Pivot points | S3 | S2 | S1 | PP | R1 | R2 | R3 |
|---|---|---|---|---|---|---|---|
| Standard | 457.1000 | 468.0000 | 487.4000 | 498.3000 | 517.7000 | 528.6000 | 548.0000 |
| Camarilla | 498.4675 | 501.2450 | 504.0225 | 506.8000 | 509.5775 | 512.3550 | 515.1325 |
| Woodie | 461.3500 | 470.1250 | 491.6500 | 500.4250 | 521.9500 | 530.7250 | 552.2500 |
| Fibonacci | 468.0000 | 479.5746 | 486.7254 | 498.3000 | 509.8746 | 517.0254 | 528.6000 |
| Pivot points | S3 | S2 | S1 | PP | R1 | R2 | R3 |
|---|---|---|---|---|---|---|---|
| Standard | 451.4333 | 466.6667 | 487.9333 | 503.1667 | 524.4333 | 539.6667 | 560.9333 |
| Camarilla | 499.1625 | 502.5083 | 505.8542 | 509.2000 | 512.5458 | 515.8917 | 519.2375 |
| Woodie | 454.4500 | 468.1750 | 490.9500 | 504.6750 | 527.4500 | 541.1750 | 563.9500 |
| Fibonacci | 466.6667 | 480.6097 | 489.2237 | 503.1667 | 517.1097 | 525.7237 | 539.6667 |
Numerical data
The following is the status of technical indicators and moving averages registered at the time this technical analysis was created:
| RSI (14): | 56.41 | |
| MACD (12,26,9): | -0.7645 | |
| Directional Movement: | 2.2769 | |
| AROON (14): | 100.0000 | |
| DEMA (21): | 494.9435 | |
| Parabolic SAR (0,02-0,02-0,2): | 478.9000 | |
| Elder Ray (13): | 6.7390 | |
| Super Trend (3,10): | 513.7039 | |
| Zig ZAG (10): | 506.8000 | |
| VORTEX (21): | 0.9756 | |
| Stochastique (14,3,5): | 59.65 | |
| TEMA (21): | 495.7852 | |
| Williams %R (14): | -7.92 | |
| Chande Momentum Oscillator (20): | 21.0000 | |
| Repulse (5,40,3): | 3.4257 | |
| ROCnROLL: | 1 | |
| TRIX (15,9): | -0.0536 | |
| Courbe Coppock: | 1.28 |
| MA7: | 495.7857 | |
| MA20: | 496.1400 | |
| MA50: | 501.0780 | |
| MA100: | 491.6570 | |
| MAexp7: | 496.8360 | |
| MAexp20: | 496.4919 | |
| MAexp50: | 497.3565 | |
| MAexp100: | 492.1432 | |
| Price / MA7: | +2.22% | |
| Price / MA20: | +2.15% | |
| Price / MA50: | +1.14% | |
| Price / MA100: | +3.08% | |
| Price / MAexp7: | +2.01% | |
| Price / MAexp20: | +2.08% | |
| Price / MAexp50: | +1.90% | |
| Price / MAexp100: | +2.98% |
News
Don't forget to follow the news on GEBERIT N. At the time of publication of this analysis, the latest news was as follows:
- 04/19/2023 - 16:53 Geberit shareholders approve all proposals
- 03/08/2023 - 05:59 Good business year under challenging conditions
- 01/19/2023 - 06:00 Currency-adjusted sales growth despite record highs of previous year
- 11/04/2022 - 07:05 Incheon Airport Selects Geberit Pluvia Roof Drainage System For Enhanced Passenger Safety and Comfort
- 03/28/2022 - 00:00 Geberit's Space-saving Innovations Tackle Sustainability Challenges for High-Density Building Developments in SEA
About author
Online


Add a comment
Comments
0 comments on the analysis GEBERIT N - Daily