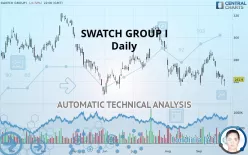
SWATCH GROUP I - Daily - Technical analysis published on 09/26/2019 (GMT)
- 244
- 0
- Who voted?
Click here for a new analysis!
- Timeframe : Daily
- - Analysis generated on
- Status : TARGET REACHED

Summary of the analysis

Additional analysis
Quotes
The SWATCH GROUP I rating is 261.90 CHF. On the day, this instrument lost -0.72% and was between 255.80 CHF and 262.70 CHF. This implies that the price is at +2.38% from its lowest and at -0.30% from its highest.The Central Gaps scanner detects a bearish opening. A small advantage for sellers in the very short term.
Bearish opening
Type : Bearish
Timeframe : Openning
So that you have an overall view of the price change, here is a table showing the variations over several periods:
Near a new LOW record (1 year)
Type : Bearish
Timeframe : Weekly
Near a new LOW record (1st january)
Type : Bearish
Timeframe : Weekly
Near a new LOW record (1 month)
Type : Bearish
Timeframe : Weekly
Technical
Technical analysis of this Daily chart of SWATCH GROUP I indicates that the overall trend is strongly bearish. 89.29% of the signals given by moving averages are bearish. This strongly bearish trend is supported by the strong bearish signals given by short-term moving averages. The Central Indicators scanner does not detect any result on moving averages that would impact this trend.
An assessment of technical indicators shows a bearish signal.
Central Indicators, the detector scanner for these technical indicators has recently detected several signals:
Pivot points : price is under support 3
Type : Neutral
Timeframe : Weekly
Price is back over the pivot point
Type : Bullish
Timeframe : Weekly
Price is back under the pivot point
Type : Bearish
Timeframe : Daily
Momentum indicator is back under 0
Type : Bearish
Timeframe : Daily
Central Patterns, the market scanner focusing on chart patterns, resistances and supports found these results:
Near support of channel
Type : Bullish
Timeframe : Daily
Horizontal support is broken
Type : Bearish
Timeframe : Daily
The Central Candlesticks scanner which studies Japanese candlesticks did not detect anything.
| S3 | S2 | S1 | Price | R1 | R2 | R3 | |
|---|---|---|---|---|---|---|---|
| ProTrendLines | 181.97 | 248.10 | 259.20 | 261.90 | 278.99 | 298.50 | 308.75 |
| Change (%) | -30.52% | -5.27% | -1.03% | - | +6.53% | +13.97% | +17.89% |
| Change | -79.93 | -13.80 | -2.70 | - | +17.09 | +36.60 | +46.85 |
| Level | Minor | Major | Intermediate | - | Minor | Major | Major |
To determine price objectives, it is also possible to use the pivot points. Here is the price position in relation to pivot points:
| Pivot points | S3 | S2 | S1 | PP | R1 | R2 | R3 |
|---|---|---|---|---|---|---|---|
| Standard | 259.10 | 261.50 | 262.90 | 265.30 | 266.70 | 269.10 | 270.50 |
| Camarilla | 263.26 | 263.60 | 263.95 | 264.30 | 264.65 | 265.00 | 265.35 |
| Woodie | 258.60 | 261.25 | 262.40 | 265.05 | 266.20 | 268.85 | 270.00 |
| Fibonacci | 261.50 | 262.95 | 263.85 | 265.30 | 266.75 | 267.65 | 269.10 |
| Pivot points | S3 | S2 | S1 | PP | R1 | R2 | R3 |
|---|---|---|---|---|---|---|---|
| Standard | 265.97 | 271.13 | 277.97 | 283.13 | 289.97 | 295.13 | 301.97 |
| Camarilla | 281.50 | 282.60 | 283.70 | 284.80 | 285.90 | 287.00 | 288.10 |
| Woodie | 266.80 | 271.55 | 278.80 | 283.55 | 290.80 | 295.55 | 302.80 |
| Fibonacci | 271.13 | 275.72 | 278.55 | 283.13 | 287.72 | 290.55 | 295.13 |
| Pivot points | S3 | S2 | S1 | PP | R1 | R2 | R3 |
|---|---|---|---|---|---|---|---|
| Standard | 230.10 | 243.10 | 255.60 | 268.60 | 281.10 | 294.10 | 306.60 |
| Camarilla | 261.09 | 263.43 | 265.76 | 268.10 | 270.44 | 272.78 | 275.11 |
| Woodie | 229.85 | 242.98 | 255.35 | 268.48 | 280.85 | 293.98 | 306.35 |
| Fibonacci | 243.10 | 252.84 | 258.86 | 268.60 | 278.34 | 284.36 | 294.10 |
Numerical data
The following is the status of technical indicators and moving averages registered at the time this technical analysis was created:
| RSI (14): | 42.52 | |
| MACD (12,26,9): | -1.3300 | |
| Directional Movement: | -17.88 | |
| AROON (14): | 50.00 | |
| DEMA (21): | 270.23 | |
| Parabolic SAR (0,02-0,02-0,2): | 284.19 | |
| Elder Ray (13): | -9.66 | |
| Super Trend (3,10): | 282.20 | |
| Zig ZAG (10): | 265.50 | |
| VORTEX (21): | 0.8600 | |
| Stochastique (14,3,5): | 26.07 | |
| TEMA (21): | 270.23 | |
| Williams %R (14): | -73.55 | |
| Chande Momentum Oscillator (20): | -9.90 | |
| Repulse (5,40,3): | -0.2500 | |
| ROCnROLL: | 2 | |
| TRIX (15,9): | -0.0100 | |
| Courbe Coppock: | 2.44 |
| MA7: | 271.06 | |
| MA20: | 271.70 | |
| MA50: | 277.62 | |
| MA100: | 275.74 | |
| MAexp7: | 269.16 | |
| MAexp20: | 271.74 | |
| MAexp50: | 274.17 | |
| MAexp100: | 278.71 | |
| Price / MA7: | -3.38% | |
| Price / MA20: | -3.61% | |
| Price / MA50: | -5.66% | |
| Price / MA100: | -5.02% | |
| Price / MAexp7: | -2.70% | |
| Price / MAexp20: | -3.62% | |
| Price / MAexp50: | -4.48% | |
| Price / MAexp100: | -6.03% |
News
Don"t forget to follow the news on SWATCH GROUP I. At the time of publication of this analysis, the latest news was as follows:
 Swatch Group
About author

Online


Add a comment
Comments
0 comments on the analysis SWATCH GROUP I - Daily