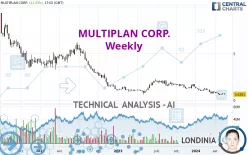
MULTIPLAN CORP. - Weekly - Technical analysis published on 05/15/2024 (GMT)
- 126
- 0
Click here for a new analysis!
- Timeframe : Weekly
- - Analysis generated on
- Status : TARGET REACHED

Summary of the analysis
Additional analysis
Quotes
The MULTIPLAN CORP. rating is 0.6281 USD. The price registered an increase of +3.44% over 5 days and has been traded over the last 5 days between 0.5919 USD and 0.7654 USD. This implies that the 5 day price is +6.12% from its lowest point and -17.94% from its highest point.The Central Gaps scanner detects a bullish opening. A small advantage for buyers in the very short term.
Bullish opening
Type : Bullish
Timeframe : Openning
So that you have an overall view of the price change, here is a table showing the variations over several periods:
Near a new LOW record (5 years)
Type : Bearish
Timeframe : Weekly
Abnormal volumes on MULTIPLAN CORP. were detected by the Central Volumes scanner:
Abnormal volumes
Timeframe : 5 days
Abnormal volumes
Timeframe : 20 days
Abnormal volumes
Timeframe : 50 days
Technical
A technical analysis in Weekly of this MULTIPLAN CORP. chart shows a sharp bearish trend. 92.86% of the signals given by moving averages are bearish. The overall trend is supported by the strong bearish signals from short-term moving averages. The Central Indicators scanner does not detect any result on moving averages that would impact this trend.
In fact, 11 technical indicators on 18 studied are currently positioned bearish. Caution: the Central Indicators scanner currently detects an excess:
Williams %R indicator is oversold : under -80
Type : Neutral
Timeframe : Weekly
Price is back under the pivot point
Type : Bearish
Timeframe : Weekly
The analysis of the price chart with Central Patterns scanners does not return any result.
For a small setback in the very short term, the Central Candlesticks scanner currently notes the presence of this bearish pattern in Japanese candlesticks:
Bearish engulfing lines
Type : Bearish
Timeframe : Weekly
| Price | R1 | R2 | R3 | |
|---|---|---|---|---|
| ProTrendLines | 0.6281 | 0.7069 | 3.4750 | 6.1322 |
| Change (%) | - | +12.55% | +453.26% | +876.31% |
| Change | - | +0.0788 | +2.8469 | +5.5041 |
| Level | - | Intermediate | Minor | Intermediate |
Pivot points can also be used to set your price objectives. Here is the price situation in relation to pivot points:
| Pivot points | S3 | S2 | S1 | PP | R1 | R2 | R3 |
|---|---|---|---|---|---|---|---|
| Standard | 0.3500 | 0.4501 | 0.5071 | 0.6072 | 0.6642 | 0.7643 | 0.8213 |
| Camarilla | 0.5210 | 0.5354 | 0.5498 | 0.5642 | 0.5786 | 0.5930 | 0.6074 |
| Woodie | 0.3286 | 0.4393 | 0.4857 | 0.5964 | 0.6428 | 0.7535 | 0.7999 |
| Fibonacci | 0.4501 | 0.5101 | 0.5472 | 0.6072 | 0.6672 | 0.7043 | 0.7643 |
| Pivot points | S3 | S2 | S1 | PP | R1 | R2 | R3 |
|---|---|---|---|---|---|---|---|
| Standard | 0.3622 | 0.4586 | 0.5824 | 0.6788 | 0.8026 | 0.8990 | 1.0228 |
| Camarilla | 0.6457 | 0.6658 | 0.6860 | 0.7062 | 0.7264 | 0.7466 | 0.7668 |
| Woodie | 0.3759 | 0.4655 | 0.5961 | 0.6857 | 0.8163 | 0.9059 | 1.0365 |
| Fibonacci | 0.4586 | 0.5427 | 0.5947 | 0.6788 | 0.7629 | 0.8149 | 0.8990 |
| Pivot points | S3 | S2 | S1 | PP | R1 | R2 | R3 |
|---|---|---|---|---|---|---|---|
| Standard | 0.1180 | 0.3240 | 0.4869 | 0.6929 | 0.8558 | 1.0618 | 1.2247 |
| Camarilla | 0.5484 | 0.5822 | 0.6160 | 0.6498 | 0.6836 | 0.7174 | 0.7513 |
| Woodie | 0.0965 | 0.3132 | 0.4654 | 0.6821 | 0.8343 | 1.0510 | 1.2032 |
| Fibonacci | 0.3240 | 0.4649 | 0.5520 | 0.6929 | 0.8338 | 0.9209 | 1.0618 |
Numerical data
The following is the status of the technical indicators and moving averages at the time of publication of this technical analysis:
| RSI (14): | 35.38 | |
| MACD (12,26,9): | -0.2075 | |
| Directional Movement: | -12.4429 | |
| AROON (14): | -71.4285 | |
| DEMA (21): | 0.6430 | |
| Parabolic SAR (0,02-0,02-0,2): | 0.8190 | |
| Elder Ray (13): | -0.1445 | |
| Super Trend (3,10): | 1.1841 | |
| Zig ZAG (10): | 0.6345 | |
| VORTEX (21): | 0.7524 | |
| Stochastique (14,3,5): | 16.37 | |
| TEMA (21): | 0.5720 | |
| Williams %R (14): | -87.44 | |
| Chande Momentum Oscillator (20): | -0.4783 | |
| Repulse (5,40,3): | -16.3648 | |
| ROCnROLL: | 2 | |
| TRIX (15,9): | -2.2002 | |
| Courbe Coppock: | 79.77 |
| MA7: | 0.6469 | |
| MA20: | 0.6351 | |
| MA50: | 0.7401 | |
| MA100: | 0.9717 | |
| MAexp7: | 0.7050 | |
| MAexp20: | 0.9113 | |
| MAexp50: | 1.2814 | |
| MAexp100: | 2.1097 | |
| Price / MA7: | -2.91% | |
| Price / MA20: | -1.10% | |
| Price / MA50: | -15.13% | |
| Price / MA100: | -35.36% | |
| Price / MAexp7: | -10.91% | |
| Price / MAexp20: | -31.08% | |
| Price / MAexp50: | -50.98% | |
| Price / MAexp100: | -70.23% |
News
The latest news and videos published on MULTIPLAN CORP. at the time of the analysis were as follows:
About author

Online


Add a comment
Comments
0 comments on the analysis MULTIPLAN CORP. - Weekly