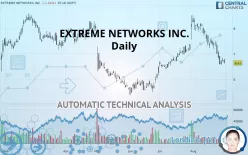
EXTREME NETWORKS INC. - Daily - Technical analysis published on 08/30/2019 (GMT)
- 395
- 0
- Who voted?
Click here for a new analysis!
- Timeframe : Daily
- - Analysis generated on
- Status : INVALID

Summary of the analysis

Additional analysis
Quotes
The EXTREME NETWORKS INC. rating is 6.63 USD. The price registered a decrease of -1.34% on the session with the lowest point at 6.61 USD and the highest point at 6.80 USD. The deviation from the price is +0.30% for the low point and -2.50% for the high point.Here is a more detailed summary of the historical variations registered by EXTREME NETWORKS INC.:
Near a new LOW record (1 month)
Type : Bearish
Timeframe : Weekly
Technical
A technical analysis in Daily of this EXTREME NETWORKS INC. chart shows a bearish trend. The signals given by moving averages are 64.29% bearish. This bearish trend is reinforced by the strong signals currently being given by short-term moving averages. The Central Indicators scanner does not detect any result on moving averages that would impact this trend.
In fact, according to the parameters integrated into the Central Analyzer system, 11 technical indicators out of 18 analysed are currently bearish. But beware of excesses. The Central Indicators scanner currently detects this:
CCI indicator is oversold : under -100
Type : Neutral
Timeframe : Daily
Williams %R indicator is oversold : under -80
Type : Neutral
Timeframe : Daily
Pivot points : price is under support 1
Type : Neutral
Timeframe : Weekly
Price is back under the pivot point
Type : Bearish
Timeframe : Daily
Central Patterns, the market scanner focusing on chart patterns, resistances and supports found these results:
Near horizontal support
Type : Bullish
Timeframe : Daily
Support of channel is broken
Type : Bearish
Timeframe : Daily
No result was found by the Central Candlesticks scanner on Japanese candlesticks.
| S3 | S2 | S1 | Price | R1 | R2 | R3 | |
|---|---|---|---|---|---|---|---|
| ProTrendLines | 5.40 | 5.86 | 6.29 | 6.63 | 6.73 | 7.28 | 7.56 |
| Change (%) | -18.55% | -11.61% | -5.13% | - | +1.51% | +9.80% | +14.03% |
| Change | -1.23 | -0.77 | -0.34 | - | +0.10 | +0.65 | +0.93 |
| Level | Major | Minor | Minor | - | Major | Intermediate | Minor |
Attention could also be paid to pivot points to set price objectives:
| Pivot points | S3 | S2 | S1 | PP | R1 | R2 | R3 |
|---|---|---|---|---|---|---|---|
| Standard | 6.52 | 6.61 | 6.66 | 6.76 | 6.81 | 6.91 | 6.96 |
| Camarilla | 6.68 | 6.69 | 6.71 | 6.72 | 6.73 | 6.75 | 6.76 |
| Woodie | 6.50 | 6.60 | 6.65 | 6.75 | 6.79 | 6.90 | 6.94 |
| Fibonacci | 6.61 | 6.67 | 6.70 | 6.76 | 6.81 | 6.85 | 6.91 |
| Pivot points | S3 | S2 | S1 | PP | R1 | R2 | R3 |
|---|---|---|---|---|---|---|---|
| Standard | 6.17 | 6.58 | 6.80 | 7.21 | 7.43 | 7.84 | 8.06 |
| Camarilla | 6.84 | 6.89 | 6.95 | 7.01 | 7.07 | 7.13 | 7.18 |
| Woodie | 6.07 | 6.53 | 6.70 | 7.16 | 7.33 | 7.79 | 7.96 |
| Fibonacci | 6.58 | 6.82 | 6.97 | 7.21 | 7.45 | 7.60 | 7.84 |
| Pivot points | S3 | S2 | S1 | PP | R1 | R2 | R3 |
|---|---|---|---|---|---|---|---|
| Standard | 4.73 | 5.56 | 6.85 | 7.67 | 8.97 | 9.79 | 11.08 |
| Camarilla | 7.56 | 7.75 | 7.95 | 8.14 | 8.33 | 8.53 | 8.72 |
| Woodie | 4.96 | 5.67 | 7.08 | 7.79 | 9.20 | 9.91 | 11.32 |
| Fibonacci | 5.56 | 6.37 | 6.87 | 7.67 | 8.48 | 8.98 | 9.79 |
Numerical data
The following is the status of the technical indicators and moving averages at the time of publication of this technical analysis:
| RSI (14): | 35.00 | |
| MACD (12,26,9): | -0.1500 | |
| Directional Movement: | -14.70 | |
| AROON (14): | -85.71 | |
| DEMA (21): | 7.05 | |
| Parabolic SAR (0,02-0,02-0,2): | 7.19 | |
| Elder Ray (13): | -0.34 | |
| Super Trend (3,10): | 7.50 | |
| Zig ZAG (10): | 6.64 | |
| VORTEX (21): | 0.6700 | |
| Stochastique (14,3,5): | 8.76 | |
| TEMA (21): | 6.72 | |
| Williams %R (14): | -86.52 | |
| Chande Momentum Oscillator (20): | -0.85 | |
| Repulse (5,40,3): | -4.2600 | |
| ROCnROLL: | 2 | |
| TRIX (15,9): | 0.0200 | |
| Courbe Coppock: | 27.05 |
| MA7: | 6.85 | |
| MA20: | 7.44 | |
| MA50: | 7.06 | |
| MA100: | 6.79 | |
| MAexp7: | 6.87 | |
| MAexp20: | 7.17 | |
| MAexp50: | 7.09 | |
| MAexp100: | 6.95 | |
| Price / MA7: | -3.21% | |
| Price / MA20: | -10.89% | |
| Price / MA50: | -6.09% | |
| Price / MA100: | -2.36% | |
| Price / MAexp7: | -3.49% | |
| Price / MAexp20: | -7.53% | |
| Price / MAexp50: | -6.49% | |
| Price / MAexp100: | -4.60% |
News
The latest news and videos published on EXTREME NETWORKS INC. at the time of the analysis were as follows:
- Booming Esports Market Has More Than 70% of Schools Considering an Esports Program
- Extreme Networks Expands Board of Directors with Appointment of Ingrid Burton
- Extreme Networks Announces Upcoming Financial Conference Schedule
- Extreme Networks Completes Acquisition of Aerohive Networks
- Extreme Networks Announces Upcoming Financial Conference Schedule
About author

Online


Add a comment
Comments
0 comments on the analysis EXTREME NETWORKS INC. - Daily