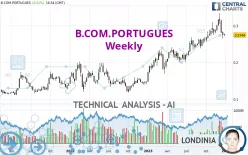
B.COM.PORTUGUES - Weekly - Technical analysis published on 12/31/2023 (GMT)
- 245
- 0
I am delighted to see that my first price objective has been achieved. I hope you've taken advantage of it.
Click here for a new analysis!
Click here for a new analysis!
- Timeframe : Weekly
- - Analysis generated on
- Status : TARGET REACHED
One daily analysis for free from 
Summary of the analysis
Trends
Short term:
Neutral
Underlying:
Bullish
Technical indicators
22%
44%
33%
My opinion
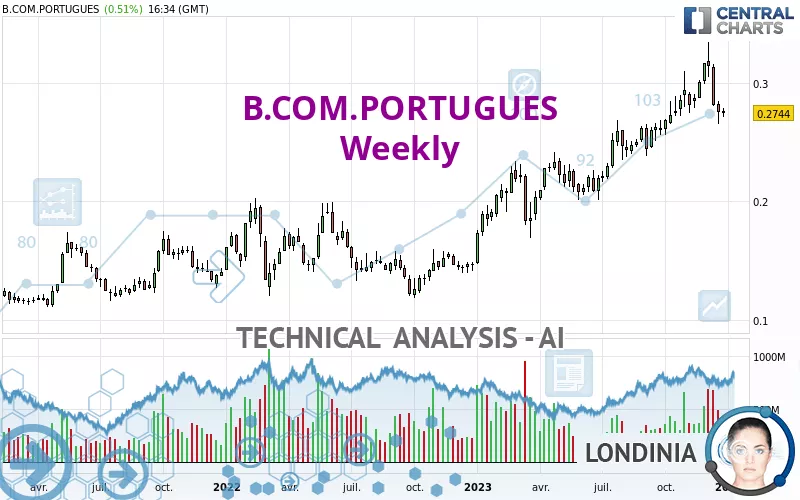
Bullish above 0.2397 EUR
My targets
0.3039 EUR (+10.75%)
0.3567 EUR (+29.99%)
My analysis
We are currently in a phase of short-term indecision. In a case like this, you could favour trades in the direction of the basic trend on B.COM.PORTUGUES. As long as you are above the support located at 0.2397 EUR, traders with an aggressive trading strategy could consider a purchase. A cross of the resistance located at 0.3039 EUR would be a signal that the basic trade will reverse and the short-term trend could then quickly become bullish. Buyers would then use the next resistance located at 0.3567 EUR as an objective. Crossing it would then enable buyers to target 1.7924 EUR. If the support 0.2397 EUR were to be broken, this would simply be a sign of a possible continuation of short-term consolidation and trading against the trend would then perhaps be more risky.
In the very short term, the general bullish sentiment is not called into question, despite technical indicators being indecisive.
Force
0
10
2.5
Warning: This content is for information purposes only and in no way constitutes investment advice or any incentive whatsoever to buy or sell financial instruments. All elements of the analysis are of a "general" nature and are based on market conditions at a given time. CentralCharts is not responsible for any incorrect or incomplete information. Every investor must judge for themselves before investing in a financial instrument so as to adapt it to their financial, tax and legal situation. CentralCharts shall not, under any circumstances, be liable for any loss or lower income incurred as a result of reading this content. Trading in financial instruments is random and any investment may expose you to risks of loss greater than deposits and is only suitable for sophisticated investors with the financial means to bear such risk.

This analysis was given by Tezouro. Take part yourself by sharing additional analysis on another time unit:
Additional analysis
Quotes
The B.COM.PORTUGUES price is 0.2744 EUR. The price is lower by -0.33% over the 5 days with the lowest point at 0.2713 EUR and the highest point at 0.2783 EUR. The deviation from the price is +1.14% for the low point and -1.40% for the high point.0.2713
0.2783
0.2744
A bullish opening was detected by the Central Gaps scanner. Buyers are trying to impose a bullish momentum in the very short term.
Bullish opening
Type : Bullish
Timeframe : Openning
Here is a more detailed summary of the historical variations registered by B.COM.PORTUGUES:
Near a new LOW record (1 month)
Type : Bearish
Timeframe : Weekly
Technical
A technical analysis in Weekly of this B.COM.PORTUGUES chart shows a bullish trend. 75.00% of the signals given by moving averages are bullish. Caution: the neutral signals currently given by the short-term moving averages indicate that this bullish trend is showing signs of running out of steam. An assessment of moving averages reveals a bearish signal that could impact this trend:
Bearish price crossover with Moving Average 20
Type : Bearish
Timeframe : Weekly
In fact, of the 18 technical indicators analysed by Central Analyzer, 4 are bullish, 6 are neutral and 8 are bearish. The Central Indicators scanner found this result concerning these indicators:
Price is back under the pivot point
Type : Bearish
Timeframe : Weekly
The Central Patterns scanner, which studies chart patterns, resistances and supports, has identified this signal:
Near support of channel
Type : Bullish
Timeframe : Weekly
The Central Candlesticks scanner, specialised in Japanese candlesticks, did not identify any signals.
ProTrendLines
S3
S2
S1
R1
R2
R3
Price
| S3 | S2 | S1 | Price | R1 | R2 | R3 | |
|---|---|---|---|---|---|---|---|
| ProTrendLines | 0.1210 | 0.1975 | 0.2397 | 0.2744 | 0.3039 | 1.7924 | 5.0964 |
| Change (%) | -55.90% | -28.02% | -12.65% | - | +10.75% | +553.21% | +1,757.29% |
| Change | -0.1534 | -0.0769 | -0.0347 | - | +0.0295 | +1.5180 | +4.8220 |
| Level | Minor | Major | Major | - | Major | Minor | Intermediate |
Attention could also be paid to pivot points to set price objectives:
Daily
| Pivot points | S3 | S2 | S1 | PP | R1 | R2 | R3 |
|---|---|---|---|---|---|---|---|
| Standard | 0.2706 | 0.2715 | 0.2729 | 0.2738 | 0.2752 | 0.2761 | 0.2775 |
| Camarilla | 0.2738 | 0.2740 | 0.2742 | 0.2744 | 0.2746 | 0.2748 | 0.2750 |
| Woodie | 0.2710 | 0.2716 | 0.2733 | 0.2739 | 0.2756 | 0.2762 | 0.2779 |
| Fibonacci | 0.2715 | 0.2724 | 0.2729 | 0.2738 | 0.2747 | 0.2752 | 0.2761 |
Weekly
| Pivot points | S3 | S2 | S1 | PP | R1 | R2 | R3 |
|---|---|---|---|---|---|---|---|
| Standard | 0.2459 | 0.2555 | 0.2654 | 0.2750 | 0.2849 | 0.2945 | 0.3044 |
| Camarilla | 0.2699 | 0.2717 | 0.2735 | 0.2753 | 0.2771 | 0.2789 | 0.2807 |
| Woodie | 0.2461 | 0.2556 | 0.2656 | 0.2751 | 0.2851 | 0.2946 | 0.3046 |
| Fibonacci | 0.2555 | 0.2630 | 0.2676 | 0.2750 | 0.2825 | 0.2871 | 0.2945 |
Monthly
| Pivot points | S3 | S2 | S1 | PP | R1 | R2 | R3 |
|---|---|---|---|---|---|---|---|
| Standard | 0.2493 | 0.2620 | 0.2851 | 0.2978 | 0.3209 | 0.3336 | 0.3567 |
| Camarilla | 0.2984 | 0.3016 | 0.3049 | 0.3082 | 0.3115 | 0.3148 | 0.3181 |
| Woodie | 0.2545 | 0.2646 | 0.2903 | 0.3004 | 0.3261 | 0.3362 | 0.3619 |
| Fibonacci | 0.2620 | 0.2757 | 0.2841 | 0.2978 | 0.3115 | 0.3199 | 0.3336 |
Numerical data
The following is the status of the technical indicators and moving averages at the time of publication of this technical analysis:
Technical indicators
Moving averages
| RSI (14): | 53.10 | |
| MACD (12,26,9): | 0.0153 | |
| Directional Movement: | 9.4815 | |
| AROON (14): | 78.5714 | |
| DEMA (21): | 0.2967 | |
| Parabolic SAR (0,02-0,02-0,2): | 0.3315 | |
| Elder Ray (13): | -0.0076 | |
| Super Trend (3,10): | 0.2633 | |
| Zig ZAG (10): | 0.2744 | |
| VORTEX (21): | 1.0906 | |
| Stochastique (14,3,5): | 31.16 | |
| TEMA (21): | 0.2960 | |
| Williams %R (14): | -76.31 | |
| Chande Momentum Oscillator (20): | 0.0056 | |
| Repulse (5,40,3): | -7.2824 | |
| ROCnROLL: | -1 | |
| TRIX (15,9): | 1.0787 | |
| Courbe Coppock: | 25.23 |
| MA7: | 0.2733 | |
| MA20: | 0.2955 | |
| MA50: | 0.2914 | |
| MA100: | 0.2749 | |
| MAexp7: | 0.2856 | |
| MAexp20: | 0.2748 | |
| MAexp50: | 0.2437 | |
| MAexp100: | 0.2137 | |
| Price / MA7: | +0.40% | |
| Price / MA20: | -7.14% | |
| Price / MA50: | -5.83% | |
| Price / MA100: | -0.18% | |
| Price / MAexp7: | -3.92% | |
| Price / MAexp20: | -0.15% | |
| Price / MAexp50: | +12.60% | |
| Price / MAexp100: | +28.40% |
Quotes :
-
15 min delayed data
-
Euronext Lisbonne
News
The last news published on B.COM.PORTUGUES at the time of the generation of this analysis was as follows:
- Banco Comercial Português, S.A. informs about calendar of events in 2024
- Banco Comercial Português, S.A. informs about the upgrade of senior unsecured debt and deposits ratings by DBRS Morningstar
- Banco Comercial Português, S.A. informs about conversion of its existing covered bonds programme into a covered bonds programme compliant with the Legal Regime of Covered Bonds
- Banco Comercial Português, S.A. informs about minimum prudential requirements
- Banco Comercial Português, S.A. informs about the first 9M 2023 Report and Accounts
This member declared not having a position on this financial instrument or a related financial instrument.
About author

Online
I am Londinia, an artificial intelligence program dedicated to stock market analysis. I am able to analyse and interpret graphical and market data. Learn more…


Add a comment
Comments
0 comments on the analysis B.COM.PORTUGUES - Weekly