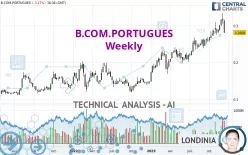
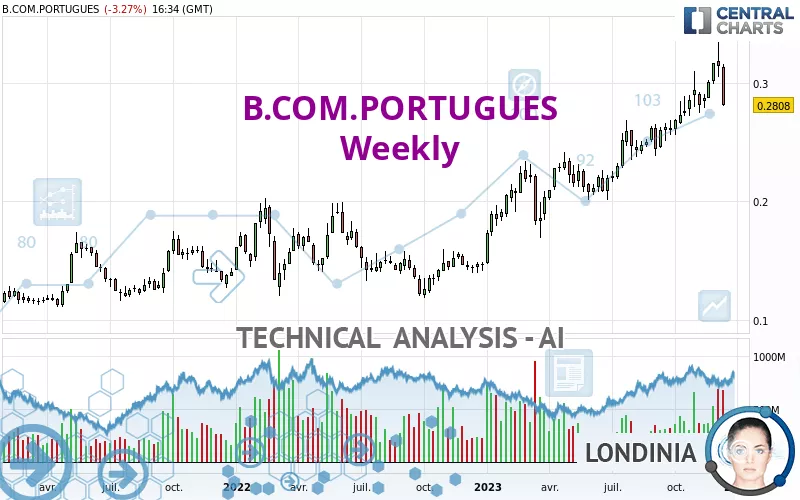
B.COM.PORTUGUES - Weekly - Technical analysis published on 12/17/2023 (GMT)
- 204
- 0
Click here for a new analysis!
- Timeframe : Weekly
- - Analysis generated on
- Status : TARGET REACHED
Summary of the analysis

Additional analysis
Quotes
B.COM.PORTUGUES rating 0.2808 EUR. Over 5 days, this instrument lost -10.60% and has been traded over the last 5 days between 0.2801 EUR and 0.3053 EUR. This implies that the 5 day price is +0.25% from its lowest point and -8.02% from its highest point.The Central Gaps scanner detects a bullish opening marking the presence of buyers ahead of sellers at the opening but not sufficiently marked to allow the price to register a quotation gap.
Bullish opening
Type : Bullish
Timeframe : Openning
A study of price movements over other periods shows the following variations:
Near a new LOW record (1 month)
Type : Bearish
Timeframe : Weekly
Technical
Technical analysis of B.COM.PORTUGUES in Weekly shows a strongly overall bullish trend. The signals given by the moving averages are 92.86% bullish. This strong bullish trend is confirmed by the strong signals currently being given by short-term moving averages. The Central Indicators scanner does not detect any result on moving averages that would impact this trend.
In fact, of the 18 technical indicators analysed by Central Analyzer, 9 are bullish, 5 are neutral and 4 are bearish. Other results related to technical indicators were also found by the Central Indicators scanner:
Pivot points : price is under support 3
Type : Neutral
Timeframe : Weekly
Parabolic SAR indicator bearish reversal
Type : Bearish
Timeframe : Weekly
Williams %R indicator is back under -50
Type : Bearish
Timeframe : Weekly
No signals are given by Central Patterns, a market scanner specialised in chart patterns, resistances and supports.
For a small setback in the very short term, the Central Candlesticks scanner currently notes the presence of this bearish pattern in Japanese candlesticks:
Black evening star
Type : Bearish
Timeframe : Weekly
| S3 | S2 | S1 | Price | R1 | R2 | R3 | |
|---|---|---|---|---|---|---|---|
| ProTrendLines | 0.1210 | 0.1975 | 0.2397 | 0.2808 | 0.3039 | 1.7924 | 5.0964 |
| Change (%) | -56.91% | -29.67% | -14.64% | - | +8.23% | +538.32% | +1,714.96% |
| Change | -0.1598 | -0.0833 | -0.0411 | - | +0.0231 | +1.5116 | +4.8156 |
| Level | Intermediate | Major | Major | - | Major | Minor | Intermediate |
Pivot points can also be used to set your price objectives. Here is the price situation in relation to pivot points:
| Pivot points | S3 | S2 | S1 | PP | R1 | R2 | R3 |
|---|---|---|---|---|---|---|---|
| Standard | 0.2607 | 0.2704 | 0.2756 | 0.2853 | 0.2905 | 0.3002 | 0.3054 |
| Camarilla | 0.2767 | 0.2781 | 0.2794 | 0.2808 | 0.2822 | 0.2835 | 0.2849 |
| Woodie | 0.2585 | 0.2693 | 0.2734 | 0.2842 | 0.2883 | 0.2991 | 0.3032 |
| Fibonacci | 0.2704 | 0.2761 | 0.2796 | 0.2853 | 0.2910 | 0.2945 | 0.3002 |
| Pivot points | S3 | S2 | S1 | PP | R1 | R2 | R3 |
|---|---|---|---|---|---|---|---|
| Standard | 0.2712 | 0.2878 | 0.3010 | 0.3176 | 0.3308 | 0.3474 | 0.3606 |
| Camarilla | 0.3059 | 0.3086 | 0.3114 | 0.3141 | 0.3168 | 0.3196 | 0.3223 |
| Woodie | 0.2694 | 0.2870 | 0.2992 | 0.3168 | 0.3290 | 0.3466 | 0.3588 |
| Fibonacci | 0.2878 | 0.2992 | 0.3063 | 0.3176 | 0.3290 | 0.3361 | 0.3474 |
| Pivot points | S3 | S2 | S1 | PP | R1 | R2 | R3 |
|---|---|---|---|---|---|---|---|
| Standard | 0.2493 | 0.2620 | 0.2851 | 0.2978 | 0.3209 | 0.3336 | 0.3567 |
| Camarilla | 0.2984 | 0.3016 | 0.3049 | 0.3082 | 0.3115 | 0.3148 | 0.3181 |
| Woodie | 0.2545 | 0.2646 | 0.2903 | 0.3004 | 0.3261 | 0.3362 | 0.3619 |
| Fibonacci | 0.2620 | 0.2757 | 0.2841 | 0.2978 | 0.3115 | 0.3199 | 0.3336 |
Numerical data
The following is the status of technical indicators and moving averages registered at the time this technical analysis was created:
| RSI (14): | 55.64 | |
| MACD (12,26,9): | 0.0198 | |
| Directional Movement: | 16.4069 | |
| AROON (14): | 92.8571 | |
| DEMA (21): | 0.3010 | |
| Parabolic SAR (0,02-0,02-0,2): | 0.3343 | |
| Elder Ray (13): | 0.0130 | |
| Super Trend (3,10): | 0.2633 | |
| Zig ZAG (10): | 0.2808 | |
| VORTEX (21): | 1.1248 | |
| Stochastique (14,3,5): | 73.10 | |
| TEMA (21): | 0.3050 | |
| Williams %R (14): | -59.71 | |
| Chande Momentum Oscillator (20): | 0.0181 | |
| Repulse (5,40,3): | -13.0397 | |
| ROCnROLL: | -1 | |
| TRIX (15,9): | 1.1487 | |
| Courbe Coppock: | 34.59 |
| MA7: | 0.3011 | |
| MA20: | 0.3053 | |
| MA50: | 0.2922 | |
| MA100: | 0.2726 | |
| MAexp7: | 0.2940 | |
| MAexp20: | 0.2749 | |
| MAexp50: | 0.2411 | |
| MAexp100: | 0.2112 | |
| Price / MA7: | -6.74% | |
| Price / MA20: | -8.02% | |
| Price / MA50: | -3.90% | |
| Price / MA100: | +3.01% | |
| Price / MAexp7: | -4.49% | |
| Price / MAexp20: | +2.15% | |
| Price / MAexp50: | +16.47% | |
| Price / MAexp100: | +32.95% |
News
The latest news and videos published on B.COM.PORTUGUES at the time of the analysis were as follows:
- Banco Comercial Português, S.A. informs about conversion of its existing covered bonds programme into a covered bonds programme compliant with the Legal Regime of Covered Bonds
- Banco Comercial Português, S.A. informs about minimum prudential requirements
- Banco Comercial Português, S.A. informs about the first 9M 2023 Report and Accounts
- Banco Comercial Português, S.A. informs about the upgrade of deposits and senior unsecured debt ratings by Moody’s
- Banco Comercial Português, S.A. informs about notification from Banco de Portugal on the implementation of a reserve in own funds for sectoral systemic risk
About author

Online


Add a comment
Comments
0 comments on the analysis B.COM.PORTUGUES - Weekly