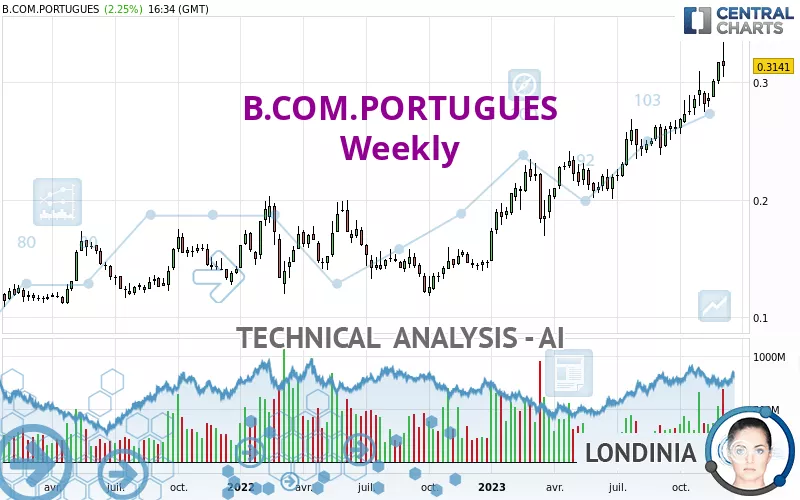
B.COM.PORTUGUES - Weekly - Technical analysis published on 12/08/2023 (GMT)
- 191
- 0
Click here for a new analysis!
- Timeframe : Weekly
- - Analysis generated on
- Status : INVALID
Summary of the analysis

Additional analysis
Quotes
B.COM.PORTUGUES rating 0.3141 EUR. The price registered a decrease of -0.88% over 5 days with the lowest point at 0.3045 EUR and the highest point at 0.3343 EUR. The deviation from the price is +3.15% for the low point and -6.04% for the high point.The Central Gaps scanner detects a bullish opening. A small advantage for buyers in the very short term.
Bullish opening
Type : Bullish
Timeframe : Openning
Here is a more detailed summary of the historical variations registered by B.COM.PORTUGUES:
New HIGH record (5 years)
Type : Bullish
Timeframe : Weekly
Technical
Technical analysis of this Weekly chart of B.COM.PORTUGUES indicates that the overall trend is strongly bullish. The signals given by the moving averages are 92.86% bullish. This strong bullish trend is confirmed by the strong signals currently being given by short-term moving averages. The Central Indicators market scanner currently does not detect any result that concerns moving averages.
The probability of a further increase is high given the direction of the technical indicators.
But beware of excesses. The Central Indicators scanner currently detects this:
RSI indicator is overbought : over 70
Type : Neutral
Timeframe : Weekly
CCI indicator is overbought : over 100
Type : Neutral
Timeframe : Weekly
Previous candle closed over Bollinger bands
Type : Neutral
Timeframe : Weekly
CCI indicator: bearish divergence
Type : Bearish
Timeframe : Weekly
RSI indicator: bearish divergence
Type : Bearish
Timeframe : Weekly
Central Patterns, the scanner specializing in chart patterns, did not identify any signals.
The Central Candlesticks scanner which studies Japanese candlesticks did not detect anything.
| S3 | S2 | S1 | Price | R1 | R2 | R3 | |
|---|---|---|---|---|---|---|---|
| ProTrendLines | 0.1975 | 0.2397 | 0.3039 | 0.3141 | 1.7924 | 5.0964 | 20.1375 |
| Change (%) | -37.12% | -23.69% | -3.25% | - | +470.65% | +1,522.54% | +6,311.17% |
| Change | -0.1166 | -0.0744 | -0.0102 | - | +1.4783 | +4.7823 | +19.8234 |
| Level | Major | Major | Major | - | Minor | Intermediate | Intermediate |
Pivot points can also be used to set your price objectives. Here is the price situation in relation to pivot points:
| Pivot points | S3 | S2 | S1 | PP | R1 | R2 | R3 |
|---|---|---|---|---|---|---|---|
| Standard | 0.2990 | 0.3023 | 0.3082 | 0.3115 | 0.3174 | 0.3207 | 0.3266 |
| Camarilla | 0.3116 | 0.3124 | 0.3133 | 0.3141 | 0.3149 | 0.3158 | 0.3166 |
| Woodie | 0.3003 | 0.3030 | 0.3095 | 0.3122 | 0.3187 | 0.3214 | 0.3279 |
| Fibonacci | 0.3023 | 0.3058 | 0.3080 | 0.3115 | 0.3150 | 0.3172 | 0.3207 |
| Pivot points | S3 | S2 | S1 | PP | R1 | R2 | R3 |
|---|---|---|---|---|---|---|---|
| Standard | 0.2867 | 0.2928 | 0.3048 | 0.3109 | 0.3229 | 0.3290 | 0.3410 |
| Camarilla | 0.3119 | 0.3136 | 0.3152 | 0.3169 | 0.3186 | 0.3202 | 0.3219 |
| Woodie | 0.2898 | 0.2943 | 0.3079 | 0.3124 | 0.3260 | 0.3305 | 0.3441 |
| Fibonacci | 0.2928 | 0.2997 | 0.3040 | 0.3109 | 0.3178 | 0.3221 | 0.3290 |
| Pivot points | S3 | S2 | S1 | PP | R1 | R2 | R3 |
|---|---|---|---|---|---|---|---|
| Standard | 0.2493 | 0.2620 | 0.2851 | 0.2978 | 0.3209 | 0.3336 | 0.3567 |
| Camarilla | 0.2984 | 0.3016 | 0.3049 | 0.3082 | 0.3115 | 0.3148 | 0.3181 |
| Woodie | 0.2545 | 0.2646 | 0.2903 | 0.3004 | 0.3261 | 0.3362 | 0.3619 |
| Fibonacci | 0.2620 | 0.2757 | 0.2841 | 0.2978 | 0.3115 | 0.3199 | 0.3336 |
Numerical data
The following are the details of the technical indicators and moving averages that were collected to generate this technical analysis:
| RSI (14): | 72.13 | |
| MACD (12,26,9): | 0.0220 | |
| Directional Movement: | 29.1757 | |
| AROON (14): | 92.8571 | |
| DEMA (21): | 0.3023 | |
| Parabolic SAR (0,02-0,02-0,2): | 0.2806 | |
| Elder Ray (13): | 0.0336 | |
| Super Trend (3,10): | 0.2633 | |
| Zig ZAG (10): | 0.3141 | |
| VORTEX (21): | 1.2141 | |
| Stochastique (14,3,5): | 88.79 | |
| TEMA (21): | 0.3087 | |
| Williams %R (14): | -20.98 | |
| Chande Momentum Oscillator (20): | 0.0542 | |
| Repulse (5,40,3): | 4.4077 | |
| ROCnROLL: | 1 | |
| TRIX (15,9): | 1.1473 | |
| Courbe Coppock: | 36.62 |
| MA7: | 0.3187 | |
| MA20: | 0.3024 | |
| MA50: | 0.2888 | |
| MA100: | 0.2705 | |
| MAexp7: | 0.2984 | |
| MAexp20: | 0.2742 | |
| MAexp50: | 0.2395 | |
| MAexp100: | 0.2098 | |
| Price / MA7: | -1.44% | |
| Price / MA20: | +3.87% | |
| Price / MA50: | +8.76% | |
| Price / MA100: | +16.12% | |
| Price / MAexp7: | +5.26% | |
| Price / MAexp20: | +14.55% | |
| Price / MAexp50: | +31.15% | |
| Price / MAexp100: | +49.71% |
News
Don't forget to follow the news on B.COM.PORTUGUES. At the time of publication of this analysis, the latest news was as follows:
- Banco Comercial Português, S.A. informs about conversion of its existing covered bonds programme into a covered bonds programme compliant with the Legal Regime of Covered Bonds
- Banco Comercial Português, S.A. informs about minimum prudential requirements
- Banco Comercial Português, S.A. informs about the first 9M 2023 Report and Accounts
- Banco Comercial Português, S.A. informs about the upgrade of deposits and senior unsecured debt ratings by Moody’s
- Banco Comercial Português, S.A. informs about notification from Banco de Portugal on the implementation of a reserve in own funds for sectoral systemic risk
About author

Online


Add a comment
Comments
0 comments on the analysis B.COM.PORTUGUES - Weekly