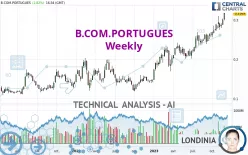
B.COM.PORTUGUES - Weekly - Technical analysis published on 12/01/2023 (GMT)
- 133
- 0
Click here for a new analysis!
- Timeframe : Weekly
- - Analysis generated on
- Status : INVALID
Summary of the analysis

Additional analysis
Quotes
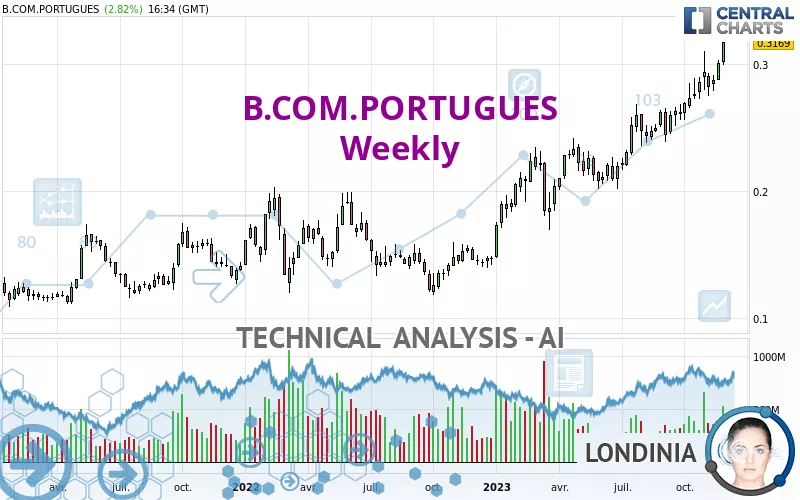
B.COM.PORTUGUES rating 0.3169 EUR. The price is up +5.35% over 5 days and has been traded over the last 5 days between 0.2988 EUR and 0.3169 EUR. This implies that the 5 day price is +6.06% from its lowest point and 0% from its highest point.A bullish opening was detected by the Central Gaps scanner. Buyers are trying to impose a bullish momentum in the very short term.
Bullish opening
Type : Bullish
Timeframe : Openning
A study of price movements over other periods shows the following variations:
New HIGH record (5 years)
Type : Bullish
Timeframe : Weekly
New HIGH record (1 year)
Type : Bullish
Timeframe : Weekly
New HIGH record (1st january)
Type : Bullish
Timeframe : Weekly
New HIGH record (1 month)
Type : Bullish
Timeframe : Weekly
Technical
Technical analysis of B.COM.PORTUGUES in Weekly shows a strongly overall bullish trend. 92.86% of the signals given by moving averages are bullish. This strongly bullish trend is supported by the strong bullish signals given by short-term moving averages. The Central Indicators market scanner currently does not detect any result that concerns moving averages.
An assessment of technical indicators shows a strong bullish signal.
Caution: the Central Indicators scanner currently detects an excess:
RSI indicator is overbought : over 70
Type : Neutral
Timeframe : Weekly
CCI indicator is overbought : over 100
Type : Neutral
Timeframe : Weekly
Williams %R indicator is overbought : over -20
Type : Neutral
Timeframe : Weekly
Pivot points : price is over resistance 2
Type : Neutral
Timeframe : Weekly
Central Patterns, the scanner specializing in chart patterns, did not identify any signals.
The Central Candlesticks scanner, specialised in Japanese candlesticks, did not identify any signals.
| S3 | S2 | S1 | Price | R1 | R2 | R3 | |
|---|---|---|---|---|---|---|---|
| ProTrendLines | 0.1219 | 0.1975 | 0.2397 | 0.3169 | 1.7924 | 5.0964 | 20.1375 |
| Change (%) | -61.53% | -37.68% | -24.36% | - | +465.60% | +1,508.20% | +6,254.53% |
| Change | -0.1950 | -0.1194 | -0.0772 | - | +1.4755 | +4.7795 | +19.8206 |
| Level | Minor | Major | Major | - | Minor | Intermediate | Intermediate |
To determine price objectives, it is also possible to use the pivot points. Here is the price position in relation to pivot points:
| Pivot points | S3 | S2 | S1 | PP | R1 | R2 | R3 |
|---|---|---|---|---|---|---|---|
| Standard | 0.2994 | 0.3029 | 0.3099 | 0.3134 | 0.3204 | 0.3239 | 0.3309 |
| Camarilla | 0.3140 | 0.3150 | 0.3159 | 0.3169 | 0.3179 | 0.3188 | 0.3198 |
| Woodie | 0.3012 | 0.3038 | 0.3117 | 0.3143 | 0.3222 | 0.3248 | 0.3327 |
| Fibonacci | 0.3029 | 0.3069 | 0.3094 | 0.3134 | 0.3174 | 0.3199 | 0.3239 |
| Pivot points | S3 | S2 | S1 | PP | R1 | R2 | R3 |
|---|---|---|---|---|---|---|---|
| Standard | 0.2763 | 0.2819 | 0.2913 | 0.2969 | 0.3063 | 0.3119 | 0.3213 |
| Camarilla | 0.2967 | 0.2981 | 0.2994 | 0.3008 | 0.3022 | 0.3036 | 0.3049 |
| Woodie | 0.2783 | 0.2829 | 0.2933 | 0.2979 | 0.3083 | 0.3129 | 0.3233 |
| Fibonacci | 0.2819 | 0.2876 | 0.2911 | 0.2969 | 0.3026 | 0.3061 | 0.3119 |
| Pivot points | S3 | S2 | S1 | PP | R1 | R2 | R3 |
|---|---|---|---|---|---|---|---|
| Standard | 0.2493 | 0.2620 | 0.2851 | 0.2978 | 0.3209 | 0.3336 | 0.3567 |
| Camarilla | 0.2984 | 0.3016 | 0.3049 | 0.3082 | 0.3115 | 0.3148 | 0.3181 |
| Woodie | 0.2545 | 0.2646 | 0.2903 | 0.3004 | 0.3261 | 0.3362 | 0.3619 |
| Fibonacci | 0.2620 | 0.2757 | 0.2841 | 0.2978 | 0.3115 | 0.3199 | 0.3336 |
Numerical data
The following is the status of technical indicators and moving averages registered at the time this technical analysis was created:
| RSI (14): | 73.84 | |
| MACD (12,26,9): | 0.0211 | |
| Directional Movement: | 25.3180 | |
| AROON (14): | 85.7143 | |
| DEMA (21): | 0.2970 | |
| Parabolic SAR (0,02-0,02-0,2): | 0.2737 | |
| Elder Ray (13): | 0.0268 | |
| Super Trend (3,10): | 0.2555 | |
| Zig ZAG (10): | 0.3169 | |
| VORTEX (21): | 1.2159 | |
| Stochastique (14,3,5): | 85.07 | |
| TEMA (21): | 0.3028 | |
| Williams %R (14): | 0.00 | |
| Chande Momentum Oscillator (20): | 0.0728 | |
| Repulse (5,40,3): | 11.3871 | |
| ROCnROLL: | 1 | |
| TRIX (15,9): | 1.1157 | |
| Courbe Coppock: | 35.57 |
| MA7: | 0.3055 | |
| MA20: | 0.2928 | |
| MA50: | 0.2828 | |
| MA100: | 0.2668 | |
| MAexp7: | 0.2931 | |
| MAexp20: | 0.2700 | |
| MAexp50: | 0.2365 | |
| MAexp100: | 0.2078 | |
| Price / MA7: | +3.73% | |
| Price / MA20: | +8.23% | |
| Price / MA50: | +12.06% | |
| Price / MA100: | +18.78% | |
| Price / MAexp7: | +8.12% | |
| Price / MAexp20: | +17.37% | |
| Price / MAexp50: | +34.00% | |
| Price / MAexp100: | +52.50% |
News
The latest news and videos published on B.COM.PORTUGUES at the time of the analysis were as follows:
- Banco Comercial Português, S.A. informs about the first 9M 2023 Report and Accounts
- Banco Comercial Português, S.A. informs about the upgrade of deposits and senior unsecured debt ratings by Moody’s
- Banco Comercial Português, S.A. informs about notification from Banco de Portugal on the implementation of a reserve in own funds for sectoral systemic risk
- Bcp Finance Bank, Ltd. and Banco Comercial Português, S.a. Announce Substitution of Issuer
- Banco Comercial Português, S.A. informs about notice of sale of securities by Fidelidade
About author

Online


Add a comment
Comments
0 comments on the analysis B.COM.PORTUGUES - Weekly