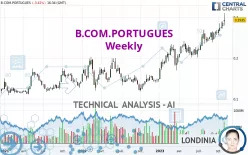
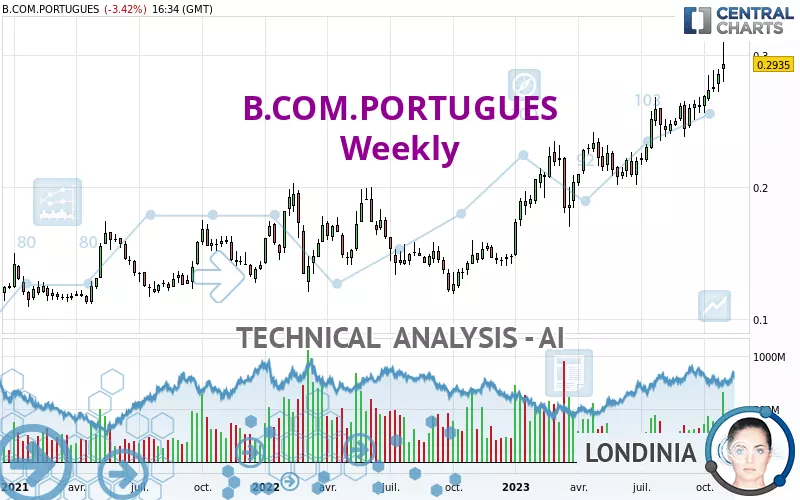
B.COM.PORTUGUES - Weekly - Technical analysis published on 11/04/2023 (GMT)
- 227
- 0
Click here for a new analysis!
- Timeframe : Weekly
- - Analysis generated on
- Status : INVALID
Summary of the analysis

Additional analysis
Quotes
The B.COM.PORTUGUES price is 0.2935 EUR. The price registered an increase of +2.73% over 5 days and was traded between 0.2795 EUR and 0.3099 EUR over the period. The price is currently at +5.01% from its lowest point and -5.29% from its highest point.A bearish opening was detected by the Central Gaps scanner. Sellers are trying to impose a bearish trend in the very short term.
Bearish opening
Type : Bearish
Timeframe : Openning
Here is a more detailed summary of the historical variations registered by B.COM.PORTUGUES:
New HIGH record (5 years)
Type : Bullish
Timeframe : Weekly
New HIGH record (1 year)
Type : Bullish
Timeframe : Weekly
New HIGH record (1st january)
Type : Bullish
Timeframe : Weekly
New HIGH record (1 month)
Type : Bullish
Timeframe : Weekly
Technical
Technical analysis of this Weekly chart of B.COM.PORTUGUES indicates that the overall trend is strongly bullish. The signals given by the moving averages are 92.86% bullish. This strong bullish trend is confirmed by the strong signals currently being given by short-term moving averages. There is no crossing of moving average by the price or crossing of moving averages between themselves.
In fact, 14 technical indicators on 18 studied are currently bullish. Caution: the Central Indicators scanner currently detects an excess:
RSI indicator is overbought : over 70
Type : Neutral
Timeframe : Weekly
CCI indicator is overbought : over 100
Type : Neutral
Timeframe : Weekly
Pivot points : price is over resistance 1
Type : Neutral
Timeframe : Weekly
Central Patterns, the market scanner focusing on chart patterns, resistances and supports found these results:
Near horizontal resistance
Type : Bearish
Timeframe : Weekly
Resistance of channel is broken
Type : Bullish
Timeframe : Weekly
No result was found by the Central Candlesticks scanner on Japanese candlesticks.
| S3 | S2 | S1 | Price | R1 | R2 | R3 | |
|---|---|---|---|---|---|---|---|
| ProTrendLines | 0.1219 | 0.1975 | 0.2397 | 0.2935 | 1.7924 | 5.0964 | 20.1375 |
| Change (%) | -58.47% | -32.71% | -18.33% | - | +510.70% | +1,636.42% | +6,761.16% |
| Change | -0.1716 | -0.0960 | -0.0538 | - | +1.4989 | +4.8029 | +19.8440 |
| Level | Minor | Major | Major | - | Minor | Intermediate | Intermediate |
Attention could also be paid to pivot points to set price objectives:
| Pivot points | S3 | S2 | S1 | PP | R1 | R2 | R3 |
|---|---|---|---|---|---|---|---|
| Standard | 0.2691 | 0.2806 | 0.2870 | 0.2985 | 0.3049 | 0.3164 | 0.3228 |
| Camarilla | 0.2886 | 0.2902 | 0.2919 | 0.2935 | 0.2951 | 0.2968 | 0.2984 |
| Woodie | 0.2667 | 0.2793 | 0.2846 | 0.2972 | 0.3025 | 0.3151 | 0.3204 |
| Fibonacci | 0.2806 | 0.2874 | 0.2916 | 0.2985 | 0.3053 | 0.3095 | 0.3164 |
| Pivot points | S3 | S2 | S1 | PP | R1 | R2 | R3 |
|---|---|---|---|---|---|---|---|
| Standard | 0.2581 | 0.2652 | 0.2754 | 0.2825 | 0.2927 | 0.2998 | 0.3100 |
| Camarilla | 0.2809 | 0.2825 | 0.2841 | 0.2857 | 0.2873 | 0.2889 | 0.2905 |
| Woodie | 0.2598 | 0.2660 | 0.2771 | 0.2833 | 0.2944 | 0.3006 | 0.3117 |
| Fibonacci | 0.2652 | 0.2718 | 0.2759 | 0.2825 | 0.2891 | 0.2932 | 0.2998 |
| Pivot points | S3 | S2 | S1 | PP | R1 | R2 | R3 |
|---|---|---|---|---|---|---|---|
| Standard | 0.2267 | 0.2413 | 0.2654 | 0.2800 | 0.3041 | 0.3187 | 0.3428 |
| Camarilla | 0.2790 | 0.2825 | 0.2861 | 0.2896 | 0.2932 | 0.2967 | 0.3002 |
| Woodie | 0.2316 | 0.2437 | 0.2703 | 0.2824 | 0.3090 | 0.3211 | 0.3477 |
| Fibonacci | 0.2413 | 0.2561 | 0.2652 | 0.2800 | 0.2948 | 0.3039 | 0.3187 |
Numerical data
The following is the status of technical indicators and moving averages registered at the time this technical analysis was created:
| RSI (14): | 71.76 | |
| MACD (12,26,9): | 0.0186 | |
| Directional Movement: | 21.6111 | |
| AROON (14): | 92.8571 | |
| DEMA (21): | 0.2803 | |
| Parabolic SAR (0,02-0,02-0,2): | 0.2437 | |
| Elder Ray (13): | 0.0287 | |
| Super Trend (3,10): | 0.2403 | |
| Zig ZAG (10): | 0.2935 | |
| VORTEX (21): | 1.1973 | |
| Stochastique (14,3,5): | 83.26 | |
| TEMA (21): | 0.2848 | |
| Williams %R (14): | -21.90 | |
| Chande Momentum Oscillator (20): | 0.0505 | |
| Repulse (5,40,3): | 3.8228 | |
| ROCnROLL: | 1 | |
| TRIX (15,9): | 1.0455 | |
| Courbe Coppock: | 32.77 |
| MA7: | 0.2921 | |
| MA20: | 0.2831 | |
| MA50: | 0.2677 | |
| MA100: | 0.2523 | |
| MAexp7: | 0.2764 | |
| MAexp20: | 0.2562 | |
| MAexp50: | 0.2259 | |
| MAexp100: | 0.2003 | |
| Price / MA7: | +0.48% | |
| Price / MA20: | +3.67% | |
| Price / MA50: | +9.64% | |
| Price / MA100: | +16.33% | |
| Price / MAexp7: | +6.19% | |
| Price / MAexp20: | +14.56% | |
| Price / MAexp50: | +29.92% | |
| Price / MAexp100: | +46.53% |
News
The last news published on B.COM.PORTUGUES at the time of the generation of this analysis was as follows:
- Banco Comercial Português, S.A. informs about consolidated earnings in the first 9M 2023
- Banco Comercial Português, S.A. informs about Bank Millennium (Poland) results in the first 9M 2023
- Banco Comercial Português, S.A. informs about notice of acquisition of securities
- Banco Comercial Português, S.A. informs about estimated provisions against legal risk related to FX mortgage loans portfolio booked by Bank Millennium, S.A. in 3Q 2023
- BCP Finance Bank 1H2023 Report
About author

Online


Add a comment
Comments
0 comments on the analysis B.COM.PORTUGUES - Weekly