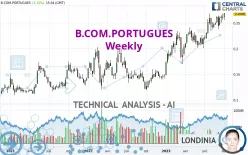
B.COM.PORTUGUES - Weekly - Technical analysis published on 10/06/2023 (GMT)
- 181
- 0
Click here for a new analysis!
- Timeframe : Weekly
- - Analysis generated on
- Status : TARGET REACHED
Summary of the analysis

Additional analysis
Quotes
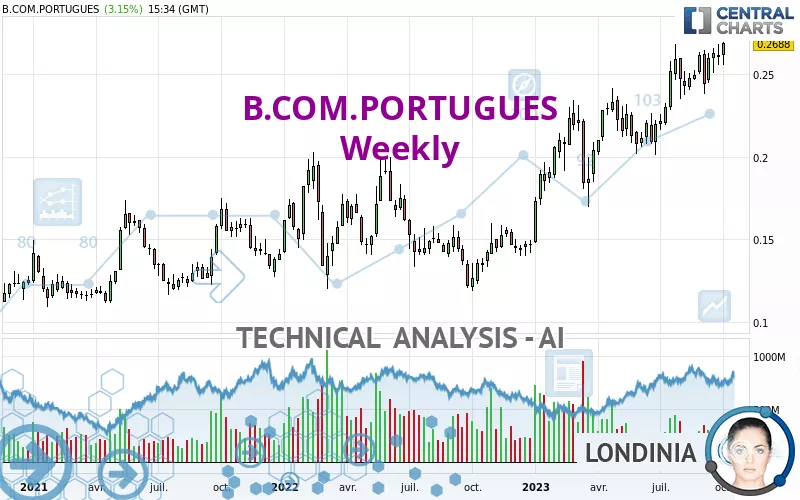
B.COM.PORTUGUES rating 0.2688 EUR. Over 5 days, this instrument gained +3.23% with the lowest point at 0.2558 EUR and the highest point at 0.2695 EUR. The deviation from the price is +5.08% for the low point and -0.26% for the high point.A bearish opening was detected by the Central Gaps scanner. Sellers are trying to impose a bearish trend in the very short term.
Bearish opening
Type : Bearish
Timeframe : Openning
A study of price movements over other periods shows the following variations:
New HIGH record (1 year)
Type : Bullish
Timeframe : Weekly
New HIGH record (1st january)
Type : Bullish
Timeframe : Weekly
New HIGH record (1 month)
Type : Bullish
Timeframe : Weekly
Technical
Technical analysis of this Weekly chart of B.COM.PORTUGUES indicates that the overall trend is strongly bullish. The signals given by the moving averages are 92.86% bullish. This strong bullish trend is confirmed by the strong signals currently being given by short-term moving averages. There is no crossing of moving average by the price or crossing of moving averages between themselves.
An assessment of technical indicators shows a strong bullish signal.
Caution: the Central Indicators scanner currently detects an excess:
Williams %R indicator is overbought : over -20
Type : Neutral
Timeframe : Weekly
Pivot points : price is over resistance 1
Type : Neutral
Timeframe : Weekly
The Central Patterns scanner, which studies chart patterns, resistances and supports, has identified these signals:
Near horizontal resistance
Type : Bearish
Timeframe : Weekly
Resistance of channel is broken
Type : Bullish
Timeframe : Weekly
The Central Candlesticks scanner, specialised in Japanese candlesticks, did not identify any signals.
| S3 | S2 | S1 | Price | R1 | R2 | R3 | |
|---|---|---|---|---|---|---|---|
| ProTrendLines | 0.1219 | 0.1975 | 0.2389 | 0.2688 | 1.7924 | 5.0964 | 20.1375 |
| Change (%) | -54.65% | -26.53% | -11.12% | - | +566.82% | +1,795.98% | +7,391.63% |
| Change | -0.1469 | -0.0713 | -0.0299 | - | +1.5236 | +4.8276 | +19.8687 |
| Level | Minor | Major | Major | - | Minor | Intermediate | Intermediate |
Attention could also be paid to pivot points to set price objectives:
| Pivot points | S3 | S2 | S1 | PP | R1 | R2 | R3 |
|---|---|---|---|---|---|---|---|
| Standard | 0.2532 | 0.2566 | 0.2627 | 0.2661 | 0.2722 | 0.2756 | 0.2817 |
| Camarilla | 0.2662 | 0.2671 | 0.2679 | 0.2688 | 0.2697 | 0.2705 | 0.2714 |
| Woodie | 0.2546 | 0.2573 | 0.2641 | 0.2668 | 0.2736 | 0.2763 | 0.2831 |
| Fibonacci | 0.2566 | 0.2602 | 0.2625 | 0.2661 | 0.2697 | 0.2720 | 0.2756 |
| Pivot points | S3 | S2 | S1 | PP | R1 | R2 | R3 |
|---|---|---|---|---|---|---|---|
| Standard | 0.2423 | 0.2491 | 0.2547 | 0.2615 | 0.2671 | 0.2739 | 0.2795 |
| Camarilla | 0.2570 | 0.2581 | 0.2593 | 0.2604 | 0.2615 | 0.2627 | 0.2638 |
| Woodie | 0.2418 | 0.2488 | 0.2542 | 0.2612 | 0.2666 | 0.2736 | 0.2790 |
| Fibonacci | 0.2491 | 0.2538 | 0.2567 | 0.2615 | 0.2662 | 0.2691 | 0.2739 |
| Pivot points | S3 | S2 | S1 | PP | R1 | R2 | R3 |
|---|---|---|---|---|---|---|---|
| Standard | 0.2127 | 0.2253 | 0.2429 | 0.2555 | 0.2731 | 0.2857 | 0.3033 |
| Camarilla | 0.2521 | 0.2549 | 0.2576 | 0.2604 | 0.2632 | 0.2659 | 0.2687 |
| Woodie | 0.2151 | 0.2266 | 0.2453 | 0.2568 | 0.2755 | 0.2870 | 0.3057 |
| Fibonacci | 0.2253 | 0.2369 | 0.2440 | 0.2555 | 0.2671 | 0.2742 | 0.2857 |
Numerical data
The following are the details of the technical indicators and moving averages that were collected to generate this technical analysis:
| RSI (14): | 64.65 | |
| MACD (12,26,9): | 0.0156 | |
| Directional Movement: | 9.9250 | |
| AROON (14): | 100.0000 | |
| DEMA (21): | 0.2638 | |
| Parabolic SAR (0,02-0,02-0,2): | 0.2244 | |
| Elder Ray (13): | 0.0116 | |
| Super Trend (3,10): | 0.2136 | |
| Zig ZAG (10): | 0.2688 | |
| VORTEX (21): | 1.1243 | |
| Stochastique (14,3,5): | 92.69 | |
| TEMA (21): | 0.2662 | |
| Williams %R (14): | -1.32 | |
| Chande Momentum Oscillator (20): | 0.0386 | |
| Repulse (5,40,3): | 6.5881 | |
| ROCnROLL: | 1 | |
| TRIX (15,9): | 0.9916 | |
| Courbe Coppock: | 34.90 |
| MA7: | 0.2623 | |
| MA20: | 0.2594 | |
| MA50: | 0.2529 | |
| MA100: | 0.2381 | |
| MAexp7: | 0.2586 | |
| MAexp20: | 0.2431 | |
| MAexp50: | 0.2161 | |
| MAexp100: | 0.1934 | |
| Price / MA7: | +2.48% | |
| Price / MA20: | +3.62% | |
| Price / MA50: | +6.29% | |
| Price / MA100: | +12.89% | |
| Price / MAexp7: | +3.94% | |
| Price / MAexp20: | +10.57% | |
| Price / MAexp50: | +24.39% | |
| Price / MAexp100: | +38.99% |
News
The latest news and videos published on B.COM.PORTUGUES at the time of the analysis were as follows:
- Banco Comercial Português, S.A. informs about estimated provisions against legal risk related to FX mortgage loans portfolio booked by Bank Millennium, S.A. in 3Q 2023
- BCP Finance Bank 1H2023 Report
- Banco Comercial Português, S.A. informs about notice of acquisition of securities
- Banco Comercial Português, S.A. informs about issue of senior preferred debt securities eligible for MREL
- Banco Comercial Português, S.A. informs about the upgrade to Investment Grade of senior debt ratings by Fitch Ratings
About author

Online


Add a comment
Comments
0 comments on the analysis B.COM.PORTUGUES - Weekly