B.COM.PORTUGUES - Weekly - Technical analysis published on 09/30/2023 (GMT)
- 158
- 0
Click here for a new analysis!
- Timeframe : Weekly
- - Analysis generated on
- Status : TARGET REACHED
Summary of the analysis

Additional analysis
Quotes
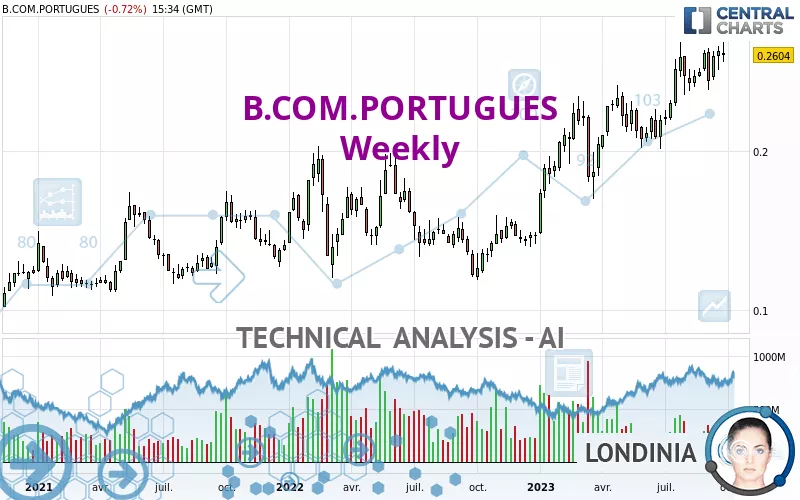
The B.COM.PORTUGUES rating is 0.2604 EUR. The price registered a decrease of -0.88% over 5 days and has been traded over the last 5 days between 0.2558 EUR and 0.2679 EUR. This implies that the 5 day price is +1.80% from its lowest point and -2.80% from its highest point.The Central Gaps scanner detects a bullish opening marking the presence of buyers ahead of sellers at the opening but not sufficiently marked to allow the price to register a quotation gap.
Bullish opening
Type : Bullish
Timeframe : Openning
A study of price movements over other periods shows the following variations:
Near a new HIGH record (1 year)
Type : Bullish
Timeframe : Weekly
Near a new HIGH record (1st january)
Type : Bullish
Timeframe : Weekly
Near a new HIGH record (1 month)
Type : Bullish
Timeframe : Weekly
Technical
Technical analysis of B.COM.PORTUGUES in Weekly shows a strongly overall bullish trend. 92.86% of the signals given by moving averages are bullish. The overall trend is supported by the strong bullish signals from short-term moving averages. The Central Indicators market scanner currently does not detect any result that concerns moving averages.
The technical indicators are bullish. There is still some doubt about the price increase.
But beware of excesses. The Central Indicators scanner currently detects this:
MACD indicator: bearish divergence
Type : Bullish
Timeframe : Weekly
Williams %R indicator is overbought : over -20
Type : Neutral
Timeframe : Weekly
Central Patterns, the market scanner focusing on chart patterns, resistances and supports found this result:
Near resistance of channel
Type : Bearish
Timeframe : Weekly
The presence of a bearish pattern in Japanese candlesticks detected by Central Candlesticks that could cause a correction in the very short term was also detected:
Bearish harami
Type : Bearish
Timeframe : Weekly
| S3 | S2 | S1 | Price | R1 | R2 | R3 | |
|---|---|---|---|---|---|---|---|
| ProTrendLines | 0.1219 | 0.1975 | 0.2389 | 0.2604 | 1.7924 | 5.0964 | 20.1375 |
| Change (%) | -53.19% | -24.16% | -8.26% | - | +588.33% | +1,857.14% | +7,633.29% |
| Change | -0.1385 | -0.0629 | -0.0215 | - | +1.5320 | +4.8360 | +19.8771 |
| Level | Minor | Major | Major | - | Minor | Minor | Major |
To determine price objectives, it is also possible to use the pivot points. Here is the price position in relation to pivot points:
| Pivot points | S3 | S2 | S1 | PP | R1 | R2 | R3 |
|---|---|---|---|---|---|---|---|
| Standard | 0.2556 | 0.2574 | 0.2589 | 0.2607 | 0.2622 | 0.2640 | 0.2655 |
| Camarilla | 0.2595 | 0.2598 | 0.2601 | 0.2604 | 0.2607 | 0.2610 | 0.2613 |
| Woodie | 0.2555 | 0.2573 | 0.2588 | 0.2606 | 0.2621 | 0.2639 | 0.2654 |
| Fibonacci | 0.2574 | 0.2587 | 0.2594 | 0.2607 | 0.2620 | 0.2627 | 0.2640 |
| Pivot points | S3 | S2 | S1 | PP | R1 | R2 | R3 |
|---|---|---|---|---|---|---|---|
| Standard | 0.2383 | 0.2444 | 0.2536 | 0.2597 | 0.2689 | 0.2750 | 0.2842 |
| Camarilla | 0.2585 | 0.2599 | 0.2613 | 0.2627 | 0.2641 | 0.2655 | 0.2669 |
| Woodie | 0.2398 | 0.2452 | 0.2551 | 0.2605 | 0.2704 | 0.2758 | 0.2857 |
| Fibonacci | 0.2444 | 0.2503 | 0.2539 | 0.2597 | 0.2656 | 0.2692 | 0.2750 |
| Pivot points | S3 | S2 | S1 | PP | R1 | R2 | R3 |
|---|---|---|---|---|---|---|---|
| Standard | 0.2155 | 0.2253 | 0.2413 | 0.2511 | 0.2671 | 0.2769 | 0.2929 |
| Camarilla | 0.2503 | 0.2527 | 0.2550 | 0.2574 | 0.2598 | 0.2621 | 0.2645 |
| Woodie | 0.2187 | 0.2269 | 0.2445 | 0.2527 | 0.2703 | 0.2785 | 0.2961 |
| Fibonacci | 0.2253 | 0.2351 | 0.2412 | 0.2511 | 0.2609 | 0.2670 | 0.2769 |
Numerical data
The following is the status of the technical indicators and moving averages at the time of publication of this technical analysis:
| RSI (14): | 62.03 | |
| MACD (12,26,9): | 0.0152 | |
| Directional Movement: | 9.9524 | |
| AROON (14): | 28.5714 | |
| DEMA (21): | 0.2606 | |
| Parabolic SAR (0,02-0,02-0,2): | 0.2226 | |
| Elder Ray (13): | 0.0138 | |
| Super Trend (3,10): | 0.2121 | |
| Zig ZAG (10): | 0.2604 | |
| VORTEX (21): | 1.1117 | |
| Stochastique (14,3,5): | 88.87 | |
| TEMA (21): | 0.2628 | |
| Williams %R (14): | -12.02 | |
| Chande Momentum Oscillator (20): | 0.0389 | |
| Repulse (5,40,3): | 2.5533 | |
| ROCnROLL: | 1 | |
| TRIX (15,9): | 0.9886 | |
| Courbe Coppock: | 35.56 |
| MA7: | 0.2615 | |
| MA20: | 0.2562 | |
| MA50: | 0.2522 | |
| MA100: | 0.2362 | |
| MAexp7: | 0.2552 | |
| MAexp20: | 0.2404 | |
| MAexp50: | 0.2140 | |
| MAexp100: | 0.1919 | |
| Price / MA7: | -0.42% | |
| Price / MA20: | +1.64% | |
| Price / MA50: | +3.25% | |
| Price / MA100: | +10.25% | |
| Price / MAexp7: | +2.04% | |
| Price / MAexp20: | +8.32% | |
| Price / MAexp50: | +21.68% | |
| Price / MAexp100: | +35.70% |
News
The latest news and videos published on B.COM.PORTUGUES at the time of the analysis were as follows:
- BCP Finance Bank 1H2023 Report
- Banco Comercial Português, S.A. informs about notice of acquisition of securities
- Banco Comercial Português, S.A. informs about issue of senior preferred debt securities eligible for MREL
- Banco Comercial Português, S.A. informs about the upgrade to Investment Grade of senior debt ratings by Fitch Ratings
- Banco Comercial Português, S.A. informs about the upgrade to Investment Grade of senior debt ratings by S&P Global
About author

Online


Add a comment
Comments
0 comments on the analysis B.COM.PORTUGUES - Weekly