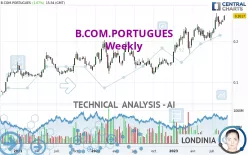
B.COM.PORTUGUES - Weekly - Technical analysis published on 09/01/2023 (GMT)
- 111
- 0
Click here for a new analysis!
- Timeframe : Weekly
- - Analysis generated on
- Status : TARGET REACHED

Summary of the analysis

Additional analysis
Quotes
B.COM.PORTUGUES rating 0.2617 EUR. Over 5 days, this instrument gained +4.81% and has been traded over the last 5 days between 0.2500 EUR and 0.2633 EUR. This implies that the 5 day price is +4.68% from its lowest point and -0.61% from its highest point.A study of price movements over other periods shows the following variations:
Near a new HIGH record (1 year)
Type : Bullish
Timeframe : Weekly
Near a new HIGH record (1st january)
Type : Bullish
Timeframe : Weekly
New HIGH record (1 month)
Type : Bullish
Timeframe : Weekly
Technical
A technical analysis in Weekly of this B.COM.PORTUGUES chart shows a strongly bullish trend. The signals given by the moving averages are 92.86% bullish. This strong bullish trend is confirmed by the strong signals currently being given by short-term moving averages. The Central Indicators market scanner currently does not detect any result that concerns moving averages.
In fact, 15 technical indicators on 18 studied are currently positioned bullish. But beware of excesses. The Central Indicators scanner currently detects this:
CCI indicator is overbought : over 100
Type : Neutral
Timeframe : Weekly
Williams %R indicator is overbought : over -20
Type : Neutral
Timeframe : Weekly
Pivot points : price is over resistance 3
Type : Neutral
Timeframe : Weekly
Central Patterns, the market scanner focusing on chart patterns, resistances and supports found this result:
Near resistance of channel
Type : Bearish
Timeframe : Weekly
The Central Candlesticks scanner, specialised in Japanese candlesticks, did not identify any signals.
| S3 | S2 | S1 | Price | R1 | R2 | R3 | |
|---|---|---|---|---|---|---|---|
| ProTrendLines | 0.1975 | 0.2389 | 0.2592 | 0.2617 | 1.7923 | 5.0964 | 20.1375 |
| Change (%) | -24.53% | -8.71% | -0.96% | - | +584.87% | +1,847.42% | +7,594.88% |
| Change | -0.0642 | -0.0228 | -0.0025 | - | +1.5306 | +4.8347 | +19.8758 |
| Level | Major | Major | Major | - | Minor | Minor | Major |
Attention could also be paid to pivot points to set price objectives:
| Pivot points | S3 | S2 | S1 | PP | R1 | R2 | R3 |
|---|---|---|---|---|---|---|---|
| Standard | 0.2516 | 0.2542 | 0.2580 | 0.2606 | 0.2644 | 0.2670 | 0.2708 |
| Camarilla | 0.2599 | 0.2605 | 0.2611 | 0.2617 | 0.2623 | 0.2629 | 0.2635 |
| Woodie | 0.2521 | 0.2545 | 0.2585 | 0.2609 | 0.2649 | 0.2673 | 0.2713 |
| Fibonacci | 0.2542 | 0.2567 | 0.2582 | 0.2606 | 0.2631 | 0.2646 | 0.2670 |
| Pivot points | S3 | S2 | S1 | PP | R1 | R2 | R3 |
|---|---|---|---|---|---|---|---|
| Standard | 0.2403 | 0.2432 | 0.2465 | 0.2494 | 0.2527 | 0.2556 | 0.2589 |
| Camarilla | 0.2480 | 0.2486 | 0.2491 | 0.2497 | 0.2503 | 0.2508 | 0.2514 |
| Woodie | 0.2404 | 0.2433 | 0.2466 | 0.2495 | 0.2528 | 0.2557 | 0.2590 |
| Fibonacci | 0.2432 | 0.2456 | 0.2471 | 0.2494 | 0.2518 | 0.2533 | 0.2556 |
| Pivot points | S3 | S2 | S1 | PP | R1 | R2 | R3 |
|---|---|---|---|---|---|---|---|
| Standard | 0.2155 | 0.2253 | 0.2413 | 0.2511 | 0.2671 | 0.2769 | 0.2929 |
| Camarilla | 0.2503 | 0.2527 | 0.2550 | 0.2574 | 0.2598 | 0.2621 | 0.2645 |
| Woodie | 0.2187 | 0.2269 | 0.2445 | 0.2527 | 0.2703 | 0.2785 | 0.2961 |
| Fibonacci | 0.2253 | 0.2351 | 0.2412 | 0.2511 | 0.2609 | 0.2670 | 0.2769 |
Numerical data
The following is the status of the technical indicators and moving averages at the time of publication of this technical analysis:
| RSI (14): | 66.52 | |
| MACD (12,26,9): | 0.0155 | |
| Directional Movement: | 16.3642 | |
| AROON (14): | 28.5714 | |
| DEMA (21): | 0.2523 | |
| Parabolic SAR (0,02-0,02-0,2): | 0.2145 | |
| Elder Ray (13): | 0.0167 | |
| Super Trend (3,10): | 0.2084 | |
| Zig ZAG (10): | 0.2617 | |
| VORTEX (21): | 1.1430 | |
| Stochastique (14,3,5): | 76.90 | |
| TEMA (21): | 0.2553 | |
| Williams %R (14): | -10.09 | |
| Chande Momentum Oscillator (20): | 0.0506 | |
| Repulse (5,40,3): | 7.3150 | |
| ROCnROLL: | 1 | |
| TRIX (15,9): | 0.9868 | |
| Courbe Coppock: | 27.68 |
| MA7: | 0.2547 | |
| MA20: | 0.2491 | |
| MA50: | 0.2406 | |
| MA100: | 0.2303 | |
| MAexp7: | 0.2482 | |
| MAexp20: | 0.2320 | |
| MAexp50: | 0.2065 | |
| MAexp100: | 0.1863 | |
| Price / MA7: | +2.75% | |
| Price / MA20: | +5.06% | |
| Price / MA50: | +8.77% | |
| Price / MA100: | +13.63% | |
| Price / MAexp7: | +5.44% | |
| Price / MAexp20: | +12.80% | |
| Price / MAexp50: | +26.73% | |
| Price / MAexp100: | +40.47% |
News
The latest news and videos published on B.COM.PORTUGUES at the time of the analysis were as follows:
- Banco Comercial Português, S.A. informs about first half 2023 Report & Accounts
- Banco Comercial Português, S.A. informs about notice of sale of securities
- Banco Comercial Português, S.A. informs about 2023 EU-Wide Stress Test Results
- Banco Comercial Português, S.A. informs about consolidated earnings in H1 2023
- Banco Comercial Português, S.A. informs about Bank Millennium (Poland) results in H1 2023
About author

Online


Add a comment
Comments
0 comments on the analysis B.COM.PORTUGUES - Weekly