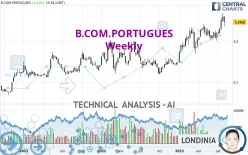
B.COM.PORTUGUES - Weekly - Technical analysis published on 08/05/2023 (GMT)
- 133
- 0
Click here for a new analysis!
- Timeframe : Weekly
- - Analysis generated on
- Status : TARGET REACHED

Summary of the analysis

Additional analysis
Quotes
The B.COM.PORTUGUES price is 0.2468 EUR. The price registered a decrease of -4.78% over 5 days and was traded between 0.2350 EUR and 0.2510 EUR over the period. The price is currently at +5.02% from its lowest point and -1.67% from its highest point.A bullish gap was detected at the opening by the Central Gaps scanner. There are a lot of buyers and they have the upper hand in the very short term.
Opening Gap UP
Type : Bullish
Timeframe : Openning
A study of price movements over other periods shows the following variations:
Technical
Technical analysis of B.COM.PORTUGUES in Weekly shows a strongly overall bullish trend. The signals given by the moving averages are 92.86% bullish. This strong bullish trend is confirmed by the strong signals currently being given by short-term moving averages. The Central Indicators market scanner currently does not detect any result that concerns moving averages.
The probability of a further increase is high given the direction of the technical indicators.
Caution: the Central Indicators scanner currently detects an excess:
CCI indicator is overbought : over 100
Type : Neutral
Timeframe : Weekly
Previous candle closed over Bollinger bands
Type : Neutral
Timeframe : Weekly
Pivot points : price is under support 1
Type : Neutral
Timeframe : Weekly
The Central Patterns scanner, which studies chart patterns, resistances and supports, has identified this signal:
Near resistance of channel
Type : Bearish
Timeframe : Weekly
For a small setback in the very short term, the Central Candlesticks scanner currently notes the presence of this bearish pattern in Japanese candlesticks:
Bearish engulfing lines
Type : Bearish
Timeframe : Weekly
| S3 | S2 | S1 | Price | R1 | R2 | R3 | |
|---|---|---|---|---|---|---|---|
| ProTrendLines | 0.1219 | 0.1975 | 0.2389 | 0.2468 | 1.7923 | 5.0964 | 20.1375 |
| Change (%) | -50.61% | -19.98% | -3.20% | - | +626.22% | +1,964.99% | +8,059.44% |
| Change | -0.1249 | -0.0493 | -0.0079 | - | +1.5455 | +4.8496 | +19.8907 |
| Level | Minor | Major | Major | - | Minor | Minor | Major |
Attention could also be paid to pivot points to set price objectives:
| Pivot points | S3 | S2 | S1 | PP | R1 | R2 | R3 |
|---|---|---|---|---|---|---|---|
| Standard | 0.2400 | 0.2423 | 0.2446 | 0.2469 | 0.2492 | 0.2515 | 0.2538 |
| Camarilla | 0.2455 | 0.2460 | 0.2464 | 0.2468 | 0.2472 | 0.2476 | 0.2481 |
| Woodie | 0.2399 | 0.2423 | 0.2445 | 0.2469 | 0.2491 | 0.2515 | 0.2537 |
| Fibonacci | 0.2423 | 0.2441 | 0.2452 | 0.2469 | 0.2487 | 0.2498 | 0.2515 |
| Pivot points | S3 | S2 | S1 | PP | R1 | R2 | R3 |
|---|---|---|---|---|---|---|---|
| Standard | 0.2256 | 0.2361 | 0.2476 | 0.2581 | 0.2696 | 0.2801 | 0.2916 |
| Camarilla | 0.2532 | 0.2552 | 0.2572 | 0.2592 | 0.2612 | 0.2632 | 0.2653 |
| Woodie | 0.2262 | 0.2364 | 0.2482 | 0.2584 | 0.2702 | 0.2804 | 0.2922 |
| Fibonacci | 0.2361 | 0.2445 | 0.2497 | 0.2581 | 0.2665 | 0.2717 | 0.2801 |
| Pivot points | S3 | S2 | S1 | PP | R1 | R2 | R3 |
|---|---|---|---|---|---|---|---|
| Standard | 0.1682 | 0.1923 | 0.2203 | 0.2444 | 0.2724 | 0.2965 | 0.3245 |
| Camarilla | 0.2340 | 0.2388 | 0.2435 | 0.2483 | 0.2531 | 0.2579 | 0.2626 |
| Woodie | 0.1702 | 0.1933 | 0.2223 | 0.2454 | 0.2744 | 0.2975 | 0.3265 |
| Fibonacci | 0.1923 | 0.2122 | 0.2245 | 0.2444 | 0.2643 | 0.2766 | 0.2965 |
Numerical data
The following are the details of the technical indicators and moving averages that were collected to generate this technical analysis:
| RSI (14): | 62.51 | |
| MACD (12,26,9): | 0.0146 | |
| Directional Movement: | 13.3823 | |
| AROON (14): | 28.5714 | |
| DEMA (21): | 0.2417 | |
| Parabolic SAR (0,02-0,02-0,2): | 0.2049 | |
| Elder Ray (13): | 0.0174 | |
| Super Trend (3,10): | 0.2036 | |
| Zig ZAG (10): | 0.2468 | |
| VORTEX (21): | 1.0483 | |
| Stochastique (14,3,5): | 81.14 | |
| TEMA (21): | 0.2447 | |
| Williams %R (14): | -32.20 | |
| Chande Momentum Oscillator (20): | 0.0315 | |
| Repulse (5,40,3): | 5.0598 | |
| ROCnROLL: | 1 | |
| TRIX (15,9): | 0.9525 | |
| Courbe Coppock: | 16.51 |
| MA7: | 0.2488 | |
| MA20: | 0.2433 | |
| MA50: | 0.2262 | |
| MA100: | 0.2203 | |
| MAexp7: | 0.2387 | |
| MAexp20: | 0.2226 | |
| MAexp50: | 0.1989 | |
| MAexp100: | 0.1809 | |
| Price / MA7: | -0.80% | |
| Price / MA20: | +1.44% | |
| Price / MA50: | +9.11% | |
| Price / MA100: | +12.03% | |
| Price / MAexp7: | +3.39% | |
| Price / MAexp20: | +10.87% | |
| Price / MAexp50: | +24.08% | |
| Price / MAexp100: | +36.43% |
News
The latest news and videos published on B.COM.PORTUGUES at the time of the analysis were as follows:
- Banco Comercial Português, S.A. informs about notice of sale of securities
- Banco Comercial Português, S.A. informs about 2023 EU-Wide Stress Test Results
- Banco Comercial Português, S.A. informs about consolidated earnings in H1 2023
- Banco Comercial Português, S.A. informs about Bank Millennium (Poland) results in H1 2023
- Banco Comercial Português, S.A. informs on notification by Banco de Portugal of its MREL requirements
About author

Online


Add a comment
Comments
0 comments on the analysis B.COM.PORTUGUES - Weekly