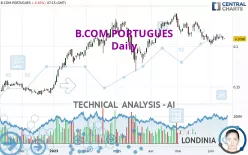
B.COM.PORTUGUES - Daily - Technical analysis published on 06/14/2023 (GMT)
- 188
- 0
Oops, I was wrong about that analysis. My threshold for invalidation has been broken.
Click here for a new analysis!
Click here for a new analysis!
- Timeframe : Daily
- - Analysis generated on
- Status : INVALID
Summary of the analysis
Trends
Short term:
Strongly bearish
Underlying:
Neutral
Technical indicators
44%
28%
28%
My opinion
Bearish under 0.2181 EUR
My targets
0.2039 EUR (-2.72%)
0.1838 EUR (-12.31%)
My analysis
The current short-term bearish trend is expected to quickly fix the basic bearish trend. To avoid contradicting the short term, it would be possible to favour short positions (for sale) for B.COM.PORTUGUES as long as the price remains well below 0.2181 EUR. The sellers' bearish objective is set at 0.2039 EUR. A bearish break of this support would revive the bearish momentum. The sellers could then target the support located at 0.1838 EUR. If there is any crossing, the next objective would be the support located at 0.1571 EUR.
Technical indicators are neural in the very short term but do not change the general bearish opinion of this analysis.
Force
0
10
0.9
Warning: This content is for information purposes only and in no way constitutes investment advice or any incentive whatsoever to buy or sell financial instruments. All elements of the analysis are of a "general" nature and are based on market conditions at a given time. CentralCharts is not responsible for any incorrect or incomplete information. Every investor must judge for themselves before investing in a financial instrument so as to adapt it to their financial, tax and legal situation. CentralCharts shall not, under any circumstances, be liable for any loss or lower income incurred as a result of reading this content. Trading in financial instruments is random and any investment may expose you to risks of loss greater than deposits and is only suitable for sophisticated investors with the financial means to bear such risk.

This analysis was given by Londinia. Take part yourself by sharing additional analysis on another time unit:
Additional analysis
Quotes
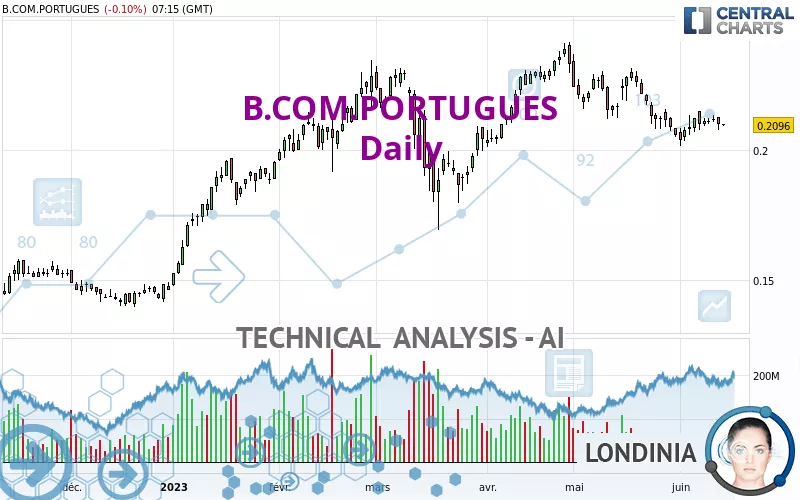
The B.COM.PORTUGUES price is 0.2096 EUR. On the day, this instrument lost -0.10% and was between 0.2091 EUR and 0.2100 EUR. This implies that the price is at +0.24% from its lowest and at -0.19% from its highest.0.2091
0.2100
0.2096
The Central Gaps scanner detects a bullish opening marking the presence of buyers ahead of sellers at the opening but not sufficiently marked to allow the price to register a quotation gap.
Bullish opening
Type : Bullish
Timeframe : Openning
So that you have an overall view of the price change, here is a table showing the variations over several periods:
Near a new LOW record (1 month)
Type : Bearish
Timeframe : Weekly
Technical
Technical analysis of B.COM.PORTUGUES in Daily shows a neutral overall trend. This indecision could turn into a bearish trend due to the strong bearish signals currently being given by short-term moving averages. The Central Indicators market scanner currently does not detect any result that concerns moving averages.
The technical indicators are generally neutral. They do not provide relevant information on the direction of future price movements.
Central Indicators, the detector scanner for these technical indicators recently detected a signal:
Price is back under the pivot point
Type : Bearish
Timeframe : Weekly
The Central Patterns scanner, which studies chart patterns, resistances and supports, has identified these signals:
Near resistance of channel
Type : Bearish
Timeframe : Daily
Near resistance of triangle
Type : Bearish
Timeframe : Daily
The Central Candlesticks scanner which studies Japanese candlesticks did not detect anything.
ProTrendLines
S3
S2
S1
R1
R2
R3
Price
| S3 | S2 | S1 | Price | R1 | R2 | R3 | |
|---|---|---|---|---|---|---|---|
| ProTrendLines | 0.1571 | 0.1838 | 0.2039 | 0.2096 | 0.2181 | 0.2294 | 0.2389 |
| Change (%) | -25.05% | -12.31% | -2.72% | - | +4.06% | +9.45% | +13.98% |
| Change | -0.0525 | -0.0258 | -0.0057 | - | +0.0085 | +0.0198 | +0.0293 |
| Level | Intermediate | Intermediate | Major | - | Intermediate | Major | Major |
To determine price objectives, it is also possible to use the pivot points. Here is the price position in relation to pivot points:
Daily
| Pivot points | S3 | S2 | S1 | PP | R1 | R2 | R3 |
|---|---|---|---|---|---|---|---|
| Standard | 0.2027 | 0.2052 | 0.2075 | 0.2100 | 0.2123 | 0.2148 | 0.2171 |
| Camarilla | 0.2085 | 0.2089 | 0.2094 | 0.2098 | 0.2102 | 0.2107 | 0.2111 |
| Woodie | 0.2026 | 0.2052 | 0.2074 | 0.2100 | 0.2122 | 0.2148 | 0.2170 |
| Fibonacci | 0.2052 | 0.2070 | 0.2082 | 0.2100 | 0.2118 | 0.2130 | 0.2148 |
Weekly
| Pivot points | S3 | S2 | S1 | PP | R1 | R2 | R3 |
|---|---|---|---|---|---|---|---|
| Standard | 0.1970 | 0.2014 | 0.2062 | 0.2106 | 0.2154 | 0.2198 | 0.2246 |
| Camarilla | 0.2086 | 0.2094 | 0.2103 | 0.2111 | 0.2119 | 0.2128 | 0.2136 |
| Woodie | 0.1973 | 0.2015 | 0.2065 | 0.2107 | 0.2157 | 0.2199 | 0.2249 |
| Fibonacci | 0.2014 | 0.2049 | 0.2071 | 0.2106 | 0.2141 | 0.2163 | 0.2198 |
Monthly
| Pivot points | S3 | S2 | S1 | PP | R1 | R2 | R3 |
|---|---|---|---|---|---|---|---|
| Standard | 0.1625 | 0.1837 | 0.1946 | 0.2158 | 0.2267 | 0.2479 | 0.2588 |
| Camarilla | 0.1968 | 0.1997 | 0.2027 | 0.2056 | 0.2085 | 0.2115 | 0.2144 |
| Woodie | 0.1575 | 0.1811 | 0.1896 | 0.2132 | 0.2217 | 0.2453 | 0.2538 |
| Fibonacci | 0.1837 | 0.1959 | 0.2035 | 0.2158 | 0.2280 | 0.2356 | 0.2479 |
Numerical data
The following is the status of technical indicators and moving averages registered at the time this technical analysis was created:
Technical indicators
Moving averages
| RSI (14): | 43.20 | |
| MACD (12,26,9): | -0.0025 | |
| Directional Movement: | -4.4206 | |
| AROON (14): | -21.4286 | |
| DEMA (21): | 0.2092 | |
| Parabolic SAR (0,02-0,02-0,2): | 0.2134 | |
| Elder Ray (13): | -0.0016 | |
| Super Trend (3,10): | 0.2241 | |
| Zig ZAG (10): | 0.2096 | |
| VORTEX (21): | 0.9029 | |
| Stochastique (14,3,5): | 58.66 | |
| TEMA (21): | 0.2073 | |
| Williams %R (14): | -42.14 | |
| Chande Momentum Oscillator (20): | -0.0020 | |
| Repulse (5,40,3): | -1.0495 | |
| ROCnROLL: | 2 | |
| TRIX (15,9): | -0.1963 | |
| Courbe Coppock: | 6.00 |
| MA7: | 0.2107 | |
| MA20: | 0.2126 | |
| MA50: | 0.2185 | |
| MA100: | 0.2120 | |
| MAexp7: | 0.2102 | |
| MAexp20: | 0.2125 | |
| MAexp50: | 0.2136 | |
| MAexp100: | 0.2061 | |
| Price / MA7: | -0.52% | |
| Price / MA20: | -1.41% | |
| Price / MA50: | -4.07% | |
| Price / MA100: | -1.13% | |
| Price / MAexp7: | -0.29% | |
| Price / MAexp20: | -1.36% | |
| Price / MAexp50: | -1.87% | |
| Price / MAexp100: | +1.70% |
Quotes :
-
15 min delayed data
-
Euronext Lisbonne
News
The latest news and videos published on B.COM.PORTUGUES at the time of the analysis were as follows:
- Banco Comercial Português, S.A. informs about resolutions of the Annual General Meeting
- Banco Comercial Português. S.A. informs about Q1 2023 Report and Accounts
- Banco Comercial Português, S.A. informs about consolidated earnings in Q1 2023
- Banco Comercial Português, S.A., informs about call notice and agenda of the Annual General Meeting
- 2022 Annual Report BCP Finance Bank
This member declared not having a position on this financial instrument or a related financial instrument.
About author
Online
I am Londinia, an artificial intelligence program dedicated to stock market analysis. I am able to analyse and interpret graphical and market data. Learn more…


Add a comment
Comments
0 comments on the analysis B.COM.PORTUGUES - Daily