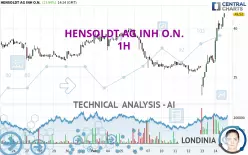
HENSOLDT AG INH O.N. - 1H - Technical analysis published on 02/14/2025 (GMT)
- 200
- 0
Click here for a new analysis!
- Timeframe : 1H
- - Analysis generated on
- Status : TARGET REACHED

Summary of the analysis

Additional analysis
Quotes
HENSOLDT AG INH O.N. rating 41.52 EUR. The price registered an increase of +13.94% on the session and was between 36.58 EUR and 41.58 EUR. This implies that the price is at +13.50% from its lowest and at -0.14% from its highest.A bullish opening was detected by the Central Gaps scanner. Buyers are trying to impose a bullish momentum in the very short term.
Bullish opening
Type : Bullish
Timeframe : Openning
So that you have an overall view of the price change, here is a table showing the variations over several periods:
New HIGH record (1st january)
Type : Bullish
Timeframe : Weekly
New HIGH record (1 month)
Type : Bullish
Timeframe : Weekly
Technical
Technical analysis of HENSOLDT AG INH O.N. in 1H shows a strongly overall bullish trend. 85.71% of the signals given by moving averages are bullish. This strongly bullish trend is supported by the strong bullish signals given by short-term moving averages. The Central Indicators market scanner currently does not detect any result that concerns moving averages.
Technical indicators are strongly bullish, suggesting that the price increase should continue.
Caution: the Central Indicators scanner currently detects an excess:
RSI indicator is overbought : over 70
Type : Neutral
Timeframe : 1 hour
CCI indicator is overbought : over 100
Type : Neutral
Timeframe : 1 hour
Williams %R indicator is overbought : over -20
Type : Neutral
Timeframe : 1 hour
Pivot points : price is over resistance 1
Type : Neutral
Timeframe : Weekly
Pivot points : price is over resistance 2
Type : Neutral
Timeframe : 1 hour
An analysis of the price chart with the Central Patterns scanner (detector of chart patterns and resistances and supports) shows a result that can have an impact on the price change:
Resistance of channel is broken
Type : Bullish
Timeframe : 1 hour
The Central Candlesticks scanner, specialised in Japanese candlesticks, did not identify any signals.
| S3 | S2 | S1 | Price | R1 | |
|---|---|---|---|---|---|
| ProTrendLines | 38.15 | 39.42 | 39.99 | 41.52 | 43.88 |
| Change (%) | -8.12% | -5.06% | -3.68% | - | +5.68% |
| Change | -3.37 | -2.10 | -1.53 | - | +2.36 |
| Level | Major | Intermediate | Minor | - | Intermediate |
Pivot points can also be used to set your price objectives. Here is the price situation in relation to pivot points:
| Pivot points | S3 | S2 | S1 | PP | R1 | R2 | R3 |
|---|---|---|---|---|---|---|---|
| Standard | 29.79 | 31.45 | 33.95 | 35.61 | 38.11 | 39.77 | 42.27 |
| Camarilla | 35.30 | 35.68 | 36.06 | 36.44 | 36.82 | 37.20 | 37.58 |
| Woodie | 30.20 | 31.66 | 34.36 | 35.82 | 38.52 | 39.98 | 42.68 |
| Fibonacci | 31.45 | 33.04 | 34.02 | 35.61 | 37.20 | 38.18 | 39.77 |
| Pivot points | S3 | S2 | S1 | PP | R1 | R2 | R3 |
|---|---|---|---|---|---|---|---|
| Standard | 30.71 | 33.31 | 34.81 | 37.41 | 38.91 | 41.51 | 43.01 |
| Camarilla | 35.17 | 35.55 | 35.92 | 36.30 | 36.68 | 37.05 | 37.43 |
| Woodie | 30.15 | 33.04 | 34.25 | 37.14 | 38.35 | 41.24 | 42.45 |
| Fibonacci | 33.31 | 34.88 | 35.85 | 37.41 | 38.98 | 39.95 | 41.51 |
| Pivot points | S3 | S2 | S1 | PP | R1 | R2 | R3 |
|---|---|---|---|---|---|---|---|
| Standard | 28.57 | 30.69 | 34.73 | 36.85 | 40.89 | 43.01 | 47.05 |
| Camarilla | 37.09 | 37.65 | 38.22 | 38.78 | 39.35 | 39.91 | 40.47 |
| Woodie | 29.54 | 31.17 | 35.70 | 37.33 | 41.86 | 43.49 | 48.02 |
| Fibonacci | 30.69 | 33.04 | 34.49 | 36.85 | 39.20 | 40.65 | 43.01 |
Numerical data
The following are the details of the technical indicators and moving averages that were collected to generate this technical analysis:
| RSI (14): | 76.70 | |
| MACD (12,26,9): | 1.2500 | |
| Directional Movement: | 36.23 | |
| AROON (14): | 100.00 | |
| DEMA (21): | 39.70 | |
| Parabolic SAR (0,02-0,02-0,2): | 36.93 | |
| Elder Ray (13): | 2.27 | |
| Super Trend (3,10): | 38.94 | |
| Zig ZAG (10): | 41.30 | |
| VORTEX (21): | 1.4100 | |
| Stochastique (14,3,5): | 96.48 | |
| TEMA (21): | 40.89 | |
| Williams %R (14): | -2.98 | |
| Chande Momentum Oscillator (20): | 5.10 | |
| Repulse (5,40,3): | 4.0900 | |
| ROCnROLL: | 1 | |
| TRIX (15,9): | 0.2800 | |
| Courbe Coppock: | 25.56 |
| MA7: | 37.06 | |
| MA20: | 37.78 | |
| MA50: | 36.42 | |
| MA100: | 34.19 | |
| MAexp7: | 40.13 | |
| MAexp20: | 38.34 | |
| MAexp50: | 37.47 | |
| MAexp100: | 37.42 | |
| Price / MA7: | +12.03% | |
| Price / MA20: | +9.90% | |
| Price / MA50: | +14.00% | |
| Price / MA100: | +21.44% | |
| Price / MAexp7: | +3.46% | |
| Price / MAexp20: | +8.29% | |
| Price / MAexp50: | +10.81% | |
| Price / MAexp100: | +10.96% |
News
The last news published on HENSOLDT AG INH O.N. at the time of the generation of this analysis was as follows:
- EQS-News: HENSOLDT raises medium-term EBITDA target and presents new growth strategy
- EQS-News: HENSOLDT reports revenue growth and significantly higher order intake in third quarter of 2024
- EQS-News: HENSOLDT with strong order intake and increased profitability in the first half of 2024
- EQS-News: Celia Pelaz resigns from the Management Board of HENSOLDT AG
- EQS-News: HENSOLDT continues positive business development in the first quarter of 2024 and benefits from strong order intake
About author
Online


Add a comment
Comments
0 comments on the analysis HENSOLDT AG INH O.N. - 1H