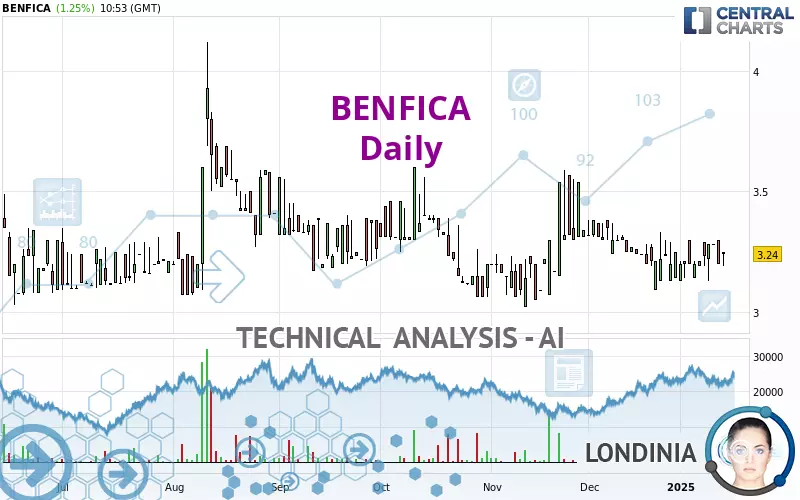
BENFICA - Daily - Technical analysis published on 01/15/2025 (GMT)
- 81
- 0
- Timeframe : Daily
- - Analysis generated on
- Status : NEUTRAL
Summary of the analysis

Additional analysis
Quotes
BENFICA rating 3.24 EUR. On the day, this instrument gained +1.25% and was between 3.19 EUR and 3.25 EUR. This implies that the price is at +1.57% from its lowest and at -0.31% from its highest.So that you have an overall view of the price change, here is a table showing the variations over several periods:
Near a new LOW record (1st january)
Type : Bearish
Timeframe : Weekly
Near a new LOW record (1 month)
Type : Bearish
Timeframe : Weekly
Technical
Technical analysis of BENFICA in Daily shows an overall slightly bearish trend. 53.57% of the signals given by moving averages are bullish. As the signals currently given by short-term moving averages are rather neutral, the overall trend could quickly return to neutral as well. The Central Indicators scanner detects bullish and bearish signals on moving averages that could impact this trend:
Bearish trend reversal : adaptative moving average 50
Type : Bearish
Timeframe : Daily
Bearish trend reversal : adaptative moving average 100
Type : Bearish
Timeframe : Daily
Bullish price crossover with Moving Average 20
Type : Bullish
Timeframe : Daily
Bullish price crossover with adaptative moving average 50
Type : Bullish
Timeframe : Daily
Bullish price crossover with adaptative moving average 100
Type : Bullish
Timeframe : Daily
An assessment of technical indicators shows a slightly bullish signal.
But beware of excesses. The Central Indicators scanner currently detects this:
MACD indicator: bullish divergence
Type : Bullish
Timeframe : Daily
Williams %R indicator is back over -50
Type : Bullish
Timeframe : Daily
The Central Patterns scanner, which studies chart patterns, resistances and supports, has identified these signals:
Near support of channel
Type : Bullish
Timeframe : Daily
Near support of triangle
Type : Bullish
Timeframe : Daily
There is also a Japanese candlestick pattern detected by Central Candlesticks that could mark the end of the current short-term trend:
Black hanging man / hammer
Type : Neutral
Timeframe : Daily
| S3 | S2 | S1 | Price | R1 | R2 | R3 | |
|---|---|---|---|---|---|---|---|
| ProTrendLines | 2.80 | 2.92 | 3.10 | 3.24 | 3.38 | 3.54 | 3.93 |
| Change (%) | -13.58% | -9.88% | -4.32% | - | +4.32% | +9.26% | +21.30% |
| Change | -0.44 | -0.32 | -0.14 | - | +0.14 | +0.30 | +0.69 |
| Level | Minor | Minor | Major | - | Minor | Intermediate | Minor |
Pivot points can also be used to set your price objectives. Here is the price situation in relation to pivot points:
| Pivot points | S3 | S2 | S1 | PP | R1 | R2 | R3 |
|---|---|---|---|---|---|---|---|
| Standard | 3.07 | 3.13 | 3.17 | 3.23 | 3.27 | 3.33 | 3.37 |
| Camarilla | 3.17 | 3.18 | 3.19 | 3.20 | 3.21 | 3.22 | 3.23 |
| Woodie | 3.05 | 3.13 | 3.15 | 3.23 | 3.25 | 3.33 | 3.35 |
| Fibonacci | 3.13 | 3.17 | 3.20 | 3.23 | 3.27 | 3.30 | 3.33 |
| Pivot points | S3 | S2 | S1 | PP | R1 | R2 | R3 |
|---|---|---|---|---|---|---|---|
| Standard | 3.00 | 3.07 | 3.17 | 3.24 | 3.34 | 3.41 | 3.51 |
| Camarilla | 3.23 | 3.25 | 3.26 | 3.28 | 3.30 | 3.31 | 3.33 |
| Woodie | 3.03 | 3.08 | 3.20 | 3.25 | 3.37 | 3.42 | 3.54 |
| Fibonacci | 3.07 | 3.13 | 3.17 | 3.24 | 3.30 | 3.34 | 3.41 |
| Pivot points | S3 | S2 | S1 | PP | R1 | R2 | R3 |
|---|---|---|---|---|---|---|---|
| Standard | 2.81 | 2.95 | 3.10 | 3.24 | 3.39 | 3.53 | 3.68 |
| Camarilla | 3.17 | 3.20 | 3.22 | 3.25 | 3.28 | 3.30 | 3.33 |
| Woodie | 2.82 | 2.95 | 3.11 | 3.24 | 3.40 | 3.53 | 3.69 |
| Fibonacci | 2.95 | 3.06 | 3.13 | 3.24 | 3.35 | 3.42 | 3.53 |
Numerical data
The following is the status of the technical indicators and moving averages at the time of publication of this technical analysis:
| RSI (14): | 49.90 | |
| MACD (12,26,9): | -0.0100 | |
| Directional Movement: | -5.90 | |
| AROON (14): | 7.14 | |
| DEMA (21): | 3.23 | |
| Parabolic SAR (0,02-0,02-0,2): | 3.12 | |
| Elder Ray (13): | -0.01 | |
| Super Trend (3,10): | 3.02 | |
| Zig ZAG (10): | 3.24 | |
| VORTEX (21): | 0.9000 | |
| Stochastique (14,3,5): | 60.00 | |
| TEMA (21): | 3.22 | |
| Williams %R (14): | -45.00 | |
| Chande Momentum Oscillator (20): | 0.00 | |
| Repulse (5,40,3): | -0.9200 | |
| ROCnROLL: | -1 | |
| TRIX (15,9): | -0.0500 | |
| Courbe Coppock: | 0.41 |
| MA7: | 3.23 | |
| MA20: | 3.23 | |
| MA50: | 3.24 | |
| MA100: | 3.28 | |
| MAexp7: | 3.23 | |
| MAexp20: | 3.24 | |
| MAexp50: | 3.25 | |
| MAexp100: | 3.24 | |
| Price / MA7: | +0.31% | |
| Price / MA20: | +0.31% | |
| Price / MA50: | -0% | |
| Price / MA100: | -1.22% | |
| Price / MAexp7: | +0.31% | |
| Price / MAexp20: | -0% | |
| Price / MAexp50: | -0.31% | |
| Price / MAexp100: | -0% |
News
The last news published on BENFICA at the time of the generation of this analysis was as follows:
-
 Benfica and Bayern grasp league titles in nail-biting final match day
- Benfica delegation meets with High Ranking Saudi Arabia Sports Officials and business partners to prepare launch of joint ventures
- Genius Sports Clinches First Live Tracking Data, Analytics, and Enhanced Broadcast Partnership in Portuguese Primeira Liga with S.L. Benfica deal
-
Portuguese Club Benfica Invites Rescued Thai Boys to Train At Soccer Camp
-
360° video: S.L. Benfica's mascot gives eagle's-eye view of the Lisbon stadium
About author
Online


Add a comment
Comments
0 comments on the analysis BENFICA - Daily