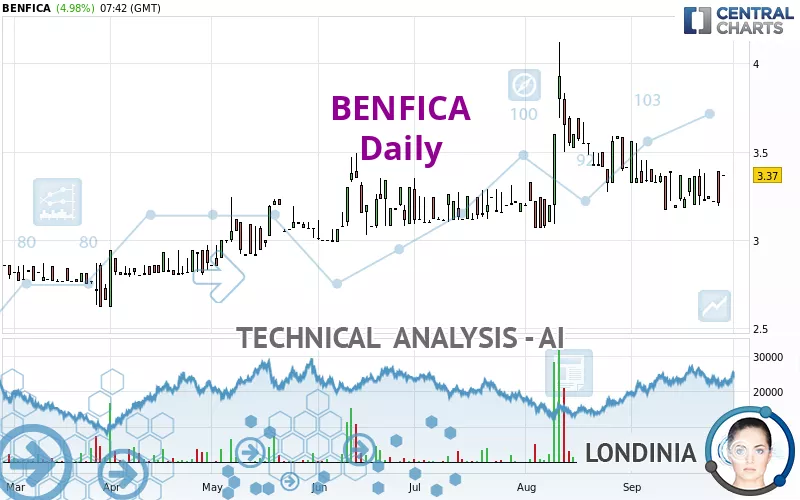
BENFICA - Daily - Technical analysis published on 09/27/2024 (GMT)
- 102
- 0
Click here for a new analysis!
- Timeframe : Daily
- - Analysis generated on
- Status : INVALID
Summary of the analysis

Additional analysis
Quotes
BENFICA rating 3.37 EUR. The price registered an increase of +4.98% on the session and was between 3.37 EUR and 3.37 EUR. This implies that the price is at 0% from its lowest and at 0% from its highest.A study of price movements over other periods shows the following variations:
Technical
A technical analysis in Daily of this BENFICA chart shows a bullish trend. 78.57% of the signals given by moving averages are bullish. This bullish trend shows slight signs of slowing down given the slightly bullish signals given by the short-term moving averages. An assessment of moving averages reveals several bullish signals that could impact this trend:
Bullish price crossover with Moving Average 20
Type : Bullish
Timeframe : Daily
Bullish price crossover with Moving Average 50
Type : Bullish
Timeframe : Daily
Bullish price crossover with Moving Average 100
Type : Bullish
Timeframe : Daily
Bullish price crossover with adaptative moving average 20
Type : Bullish
Timeframe : Daily
Bullish price crossover with adaptative moving average 50
Type : Bullish
Timeframe : Daily
In fact, 11 technical indicators on 18 studied are currently positioned bullish. Central Indicators, the scanner specialised in technical indicators, has identified these signals:
Pivot points : price is over resistance 1
Type : Neutral
Timeframe : Daily
Price is back over the pivot point
Type : Bullish
Timeframe : Weekly
The Central Patterns scanner, which studies chart patterns, resistances and supports, has identified these signals:
Near horizontal resistance
Type : Bearish
Timeframe : Daily
Resistance of channel is broken
Type : Bullish
Timeframe : Daily
The presence of these Japanese chandelier patterns detected by Central Candlesticks that could impact the current short-term trend were also noted:
Bullish harami cross
Type : Bullish
Timeframe : Daily
Doji
Type : Neutral
Timeframe : Daily
| S3 | S2 | S1 | Price | R1 | R2 | R3 | |
|---|---|---|---|---|---|---|---|
| ProTrendLines | 2.98 | 3.10 | 3.22 | 3.37 | 3.38 | 3.54 | 3.93 |
| Change (%) | -11.57% | -8.01% | -4.45% | - | +0.30% | +5.04% | +16.62% |
| Change | -0.39 | -0.27 | -0.15 | - | +0.01 | +0.17 | +0.56 |
| Level | Minor | Major | Minor | - | Major | Intermediate | Intermediate |
Attention could also be paid to pivot points to set price objectives:
| Pivot points | S3 | S2 | S1 | PP | R1 | R2 | R3 |
|---|---|---|---|---|---|---|---|
| Standard | 2.94 | 3.06 | 3.14 | 3.26 | 3.34 | 3.46 | 3.54 |
| Camarilla | 3.16 | 3.17 | 3.19 | 3.21 | 3.23 | 3.25 | 3.27 |
| Woodie | 2.91 | 3.05 | 3.11 | 3.25 | 3.31 | 3.45 | 3.51 |
| Fibonacci | 3.06 | 3.14 | 3.19 | 3.26 | 3.34 | 3.39 | 3.46 |
| Pivot points | S3 | S2 | S1 | PP | R1 | R2 | R3 |
|---|---|---|---|---|---|---|---|
| Standard | 2.93 | 3.06 | 3.15 | 3.28 | 3.37 | 3.50 | 3.59 |
| Camarilla | 3.19 | 3.21 | 3.23 | 3.25 | 3.27 | 3.29 | 3.31 |
| Woodie | 2.92 | 3.05 | 3.14 | 3.27 | 3.36 | 3.49 | 3.58 |
| Fibonacci | 3.06 | 3.14 | 3.19 | 3.28 | 3.36 | 3.41 | 3.50 |
| Pivot points | S3 | S2 | S1 | PP | R1 | R2 | R3 |
|---|---|---|---|---|---|---|---|
| Standard | 1.90 | 2.48 | 2.95 | 3.53 | 4.00 | 4.58 | 5.05 |
| Camarilla | 3.12 | 3.22 | 3.31 | 3.41 | 3.51 | 3.60 | 3.70 |
| Woodie | 1.84 | 2.45 | 2.89 | 3.50 | 3.94 | 4.55 | 4.99 |
| Fibonacci | 2.48 | 2.88 | 3.13 | 3.53 | 3.93 | 4.18 | 4.58 |
Numerical data
The following is the status of the technical indicators and moving averages at the time of publication of this technical analysis:
| RSI (14): | 52.47 | |
| MACD (12,26,9): | -0.0300 | |
| Directional Movement: | 14.19 | |
| AROON (14): | 50.00 | |
| DEMA (21): | 3.27 | |
| Parabolic SAR (0,02-0,02-0,2): | 3.17 | |
| Elder Ray (13): | 0.08 | |
| Super Trend (3,10): | 3.61 | |
| Zig ZAG (10): | 3.37 | |
| VORTEX (21): | 0.8100 | |
| Stochastique (14,3,5): | 42.03 | |
| TEMA (21): | 3.24 | |
| Williams %R (14): | -13.04 | |
| Chande Momentum Oscillator (20): | 0.20 | |
| Repulse (5,40,3): | -5.0900 | |
| ROCnROLL: | 1 | |
| TRIX (15,9): | -0.1300 | |
| Courbe Coppock: | 4.75 |
| MA7: | 3.27 | |
| MA20: | 3.31 | |
| MA50: | 3.34 | |
| MA100: | 3.24 | |
| MAexp7: | 3.28 | |
| MAexp20: | 3.31 | |
| MAexp50: | 3.31 | |
| MAexp100: | 3.24 | |
| Price / MA7: | +3.06% | |
| Price / MA20: | +1.81% | |
| Price / MA50: | +0.90% | |
| Price / MA100: | +4.01% | |
| Price / MAexp7: | +2.74% | |
| Price / MAexp20: | +1.81% | |
| Price / MAexp50: | +1.81% | |
| Price / MAexp100: | +4.01% |
News
The latest news and videos published on BENFICA at the time of the analysis were as follows:
-
 Benfica and Bayern grasp league titles in nail-biting final match day
- Benfica delegation meets with High Ranking Saudi Arabia Sports Officials and business partners to prepare launch of joint ventures
- Genius Sports Clinches First Live Tracking Data, Analytics, and Enhanced Broadcast Partnership in Portuguese Primeira Liga with S.L. Benfica deal
-
Portuguese Club Benfica Invites Rescued Thai Boys to Train At Soccer Camp
-
360° video: S.L. Benfica's mascot gives eagle's-eye view of the Lisbon stadium
About author
Online


Add a comment
Comments
0 comments on the analysis BENFICA - Daily