BENFICA - Daily - Technical analysis published on 06/12/2024 (GMT)
- 116
- 0
Click here for a new analysis!
- Timeframe : Daily
- - Analysis generated on
- Status : INVALID
Summary of the analysis

Additional analysis
Quotes
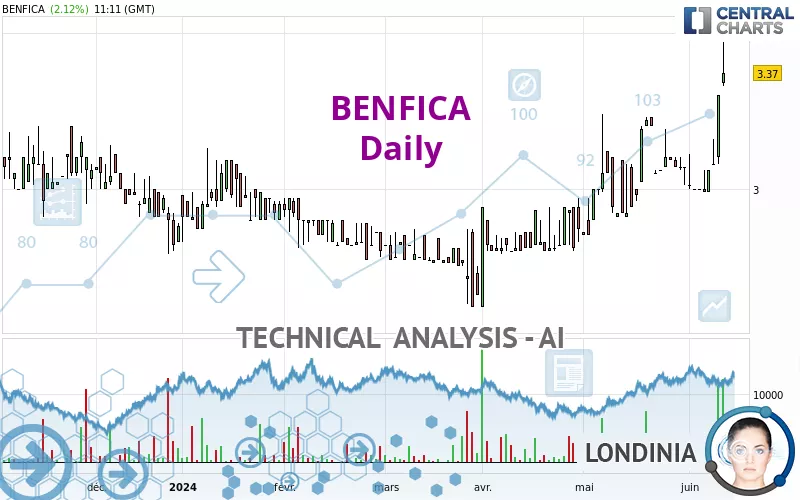
BENFICA rating 3.37 EUR. On the day, this instrument gained +2.12% with the lowest point at 3.33 EUR and the highest point at 3.47 EUR. The deviation from the price is +1.20% for the low point and -2.88% for the high point.The Central Gaps scanner detects a bullish gap which is a sign that buyers have taken the lead in the very short term.
Opening Gap UP
Type : Bullish
Timeframe : Openning
So that you have an overall view of the price change, here is a table showing the variations over several periods:
New HIGH record (1st january)
Type : Bullish
Timeframe : Weekly
New HIGH record (1 month)
Type : Bullish
Timeframe : Weekly
The Central Volumes scanner notes the presence of abnormal volumes:
Abnormal volumes
Timeframe : 5 days
Technical
Technical analysis of BENFICA in Daily shows a strongly overall bullish trend. 92.86% of the signals given by moving averages are bullish. The overall trend is supported by the strong bullish signals from short-term moving averages. The Central Indicators market scanner currently does not detect any result that concerns moving averages.
An assessment of technical indicators shows a strong bullish signal.
Caution: the Central Indicators scanner currently detects an excess:
RSI indicator is overbought : over 70
Type : Neutral
Timeframe : Daily
CCI indicator is overbought : over 100
Type : Neutral
Timeframe : Daily
Previous candle closed over Bollinger bands
Type : Neutral
Timeframe : Daily
Pivot points : price is over resistance 3
Type : Neutral
Timeframe : Weekly
An analysis of the price chart with the Central Patterns scanner (detector of chart patterns and resistances and supports) shows several results that can have an impact on the price change:
Near horizontal resistance
Type : Bearish
Timeframe : Daily
Resistance of channel is broken
Type : Bullish
Timeframe : Daily
The presence of a bullish Japanese candlestick pattern detected by Central Candlesticks that could cause a very short term rebound was also detected:
Upside gap
Type : Bullish
Timeframe : Daily
| S3 | S2 | S1 | Price | R1 | R2 | R3 | |
|---|---|---|---|---|---|---|---|
| ProTrendLines | 3.09 | 3.22 | 3.33 | 3.37 | 3.54 | 4.07 | 4.74 |
| Change (%) | -8.31% | -4.45% | -1.19% | - | +5.04% | +20.77% | +40.65% |
| Change | -0.28 | -0.15 | -0.04 | - | +0.17 | +0.70 | +1.37 |
| Level | Intermediate | Intermediate | Minor | - | Intermediate | Intermediate | Minor |
Pivot points can also be used to set your price objectives. Here is the price situation in relation to pivot points:
| Pivot points | S3 | S2 | S1 | PP | R1 | R2 | R3 |
|---|---|---|---|---|---|---|---|
| Standard | 2.93 | 3.01 | 3.15 | 3.23 | 3.37 | 3.45 | 3.59 |
| Camarilla | 3.24 | 3.26 | 3.28 | 3.30 | 3.32 | 3.34 | 3.36 |
| Woodie | 2.97 | 3.03 | 3.19 | 3.25 | 3.41 | 3.47 | 3.63 |
| Fibonacci | 3.01 | 3.09 | 3.14 | 3.23 | 3.31 | 3.36 | 3.45 |
| Pivot points | S3 | S2 | S1 | PP | R1 | R2 | R3 |
|---|---|---|---|---|---|---|---|
| Standard | 2.88 | 2.93 | 3.00 | 3.05 | 3.12 | 3.17 | 3.24 |
| Camarilla | 3.03 | 3.04 | 3.05 | 3.06 | 3.07 | 3.08 | 3.09 |
| Woodie | 2.88 | 2.94 | 3.00 | 3.06 | 3.12 | 3.18 | 3.24 |
| Fibonacci | 2.93 | 2.98 | 3.01 | 3.05 | 3.10 | 3.13 | 3.17 |
| Pivot points | S3 | S2 | S1 | PP | R1 | R2 | R3 |
|---|---|---|---|---|---|---|---|
| Standard | 2.48 | 2.66 | 2.87 | 3.05 | 3.26 | 3.44 | 3.65 |
| Camarilla | 2.96 | 3.00 | 3.03 | 3.07 | 3.11 | 3.14 | 3.18 |
| Woodie | 2.49 | 2.67 | 2.88 | 3.06 | 3.27 | 3.45 | 3.66 |
| Fibonacci | 2.66 | 2.81 | 2.90 | 3.05 | 3.20 | 3.29 | 3.44 |
Numerical data
The following are the details of the technical indicators and moving averages that were collected to generate this technical analysis:
| RSI (14): | 73.94 | |
| MACD (12,26,9): | 0.0600 | |
| Directional Movement: | 43.32 | |
| AROON (14): | 28.57 | |
| DEMA (21): | 3.17 | |
| Parabolic SAR (0,02-0,02-0,2): | 3.00 | |
| Elder Ray (13): | 0.28 | |
| Super Trend (3,10): | 3.11 | |
| Zig ZAG (10): | 3.37 | |
| VORTEX (21): | 1.2000 | |
| Stochastique (14,3,5): | 72.22 | |
| TEMA (21): | 3.19 | |
| Williams %R (14): | -20.83 | |
| Chande Momentum Oscillator (20): | 0.27 | |
| Repulse (5,40,3): | 4.7400 | |
| ROCnROLL: | 1 | |
| TRIX (15,9): | 0.2200 | |
| Courbe Coppock: | 3.50 |
| MA7: | 3.11 | |
| MA20: | 3.09 | |
| MA50: | 2.96 | |
| MA100: | 2.90 | |
| MAexp7: | 3.17 | |
| MAexp20: | 3.09 | |
| MAexp50: | 3.00 | |
| MAexp100: | 2.97 | |
| Price / MA7: | +8.36% | |
| Price / MA20: | +9.06% | |
| Price / MA50: | +13.85% | |
| Price / MA100: | +16.21% | |
| Price / MAexp7: | +6.31% | |
| Price / MAexp20: | +9.06% | |
| Price / MAexp50: | +12.33% | |
| Price / MAexp100: | +13.47% |
News
The last news published on BENFICA at the time of the generation of this analysis was as follows:
-
 Benfica and Bayern grasp league titles in nail-biting final match day
- Benfica delegation meets with High Ranking Saudi Arabia Sports Officials and business partners to prepare launch of joint ventures
- Genius Sports Clinches First Live Tracking Data, Analytics, and Enhanced Broadcast Partnership in Portuguese Primeira Liga with S.L. Benfica deal
-
Portuguese Club Benfica Invites Rescued Thai Boys to Train At Soccer Camp
-
360° video: S.L. Benfica's mascot gives eagle's-eye view of the Lisbon stadium
About author
Online


Add a comment
Comments
0 comments on the analysis BENFICA - Daily