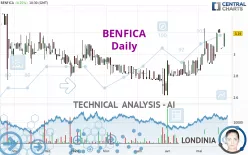
BENFICA - Daily - Technical analysis published on 05/27/2024 (GMT)
- 113
- 0
Click here for a new analysis!
- Timeframe : Daily
- - Analysis generated on
- Status : INVALID

Summary of the analysis

Additional analysis
Quotes
BENFICA rating 3.19 EUR. The price has increased by +4.25% since the last closing with the lowest point at 3.07 EUR and the highest point at 3.19 EUR. The deviation from the price is +3.91% for the low point and 0% for the high point.The Central Gaps scanner detects a bullish gap which is a sign that buyers have taken the lead in the very short term.
Opening Gap UP
Type : Bullish
Timeframe : Openning
A study of price movements over other periods shows the following variations:
Near a new HIGH record (1st january)
Type : Bullish
Timeframe : Weekly
Near a new HIGH record (1 month)
Type : Bullish
Timeframe : Weekly
Technical
Technical analysis of BENFICA in Daily shows a strongly overall bullish trend. 85.71% of the signals given by moving averages are bullish. The overall trend is supported by the strong bullish signals from short-term moving averages. There is no crossing of moving average by the price or crossing of moving averages between themselves.
Technical indicators are strongly bullish, suggesting that the price increase should continue.
But beware of excesses. The Central Indicators scanner currently detects this:
CCI indicator is overbought : over 100
Type : Neutral
Timeframe : Daily
Williams %R indicator is overbought : over -20
Type : Neutral
Timeframe : Daily
Pivot points : price is over resistance 1
Type : Neutral
Timeframe : Weekly
Pivot points : price is over resistance 3
Type : Neutral
Timeframe : Daily
Aroon indicator bearish trend
Type : Bearish
Timeframe : Daily
The Central Patterns scanner, which studies chart patterns, resistances and supports, has identified this signal:
Near support of channel
Type : Bullish
Timeframe : Daily
The Central Candlesticks scanner, specialised in Japanese candlesticks, did not identify any signals.
| S3 | S2 | S1 | Price | R1 | R2 | R3 | |
|---|---|---|---|---|---|---|---|
| ProTrendLines | 2.82 | 2.92 | 3.10 | 3.19 | 3.22 | 3.33 | 3.54 |
| Change (%) | -11.60% | -8.46% | -2.82% | - | +0.94% | +4.39% | +10.97% |
| Change | -0.37 | -0.27 | -0.09 | - | +0.03 | +0.14 | +0.35 |
| Level | Intermediate | Minor | Major | - | Minor | Minor | Intermediate |
Pivot points can also be used to set your price objectives. Here is the price situation in relation to pivot points:
| Pivot points | S3 | S2 | S1 | PP | R1 | R2 | R3 |
|---|---|---|---|---|---|---|---|
| Standard | 3.06 | 3.06 | 3.06 | 3.06 | 3.06 | 3.06 | 3.06 |
| Camarilla | 3.06 | 3.06 | 3.06 | 3.06 | 3.06 | 3.06 | 3.06 |
| Woodie | 3.06 | 3.06 | 3.06 | 3.06 | 3.06 | 3.06 | 3.06 |
| Fibonacci | 3.06 | 3.06 | 3.06 | 3.06 | 3.06 | 3.06 | 3.06 |
| Pivot points | S3 | S2 | S1 | PP | R1 | R2 | R3 |
|---|---|---|---|---|---|---|---|
| Standard | 2.77 | 2.89 | 2.98 | 3.10 | 3.19 | 3.31 | 3.40 |
| Camarilla | 3.00 | 3.02 | 3.04 | 3.06 | 3.08 | 3.10 | 3.12 |
| Woodie | 2.75 | 2.88 | 2.96 | 3.09 | 3.17 | 3.30 | 3.38 |
| Fibonacci | 2.89 | 2.97 | 3.02 | 3.10 | 3.18 | 3.23 | 3.31 |
| Pivot points | S3 | S2 | S1 | PP | R1 | R2 | R3 |
|---|---|---|---|---|---|---|---|
| Standard | 2.32 | 2.47 | 2.67 | 2.82 | 3.02 | 3.17 | 3.37 |
| Camarilla | 2.77 | 2.81 | 2.84 | 2.87 | 2.90 | 2.93 | 2.97 |
| Woodie | 2.35 | 2.48 | 2.70 | 2.83 | 3.05 | 3.18 | 3.40 |
| Fibonacci | 2.47 | 2.60 | 2.69 | 2.82 | 2.95 | 3.04 | 3.17 |
Numerical data
The following is the status of the technical indicators and moving averages at the time of publication of this technical analysis:
| RSI (14): | 63.53 | |
| MACD (12,26,9): | 0.0700 | |
| Directional Movement: | 25.99 | |
| AROON (14): | -21.43 | |
| DEMA (21): | 3.11 | |
| Parabolic SAR (0,02-0,02-0,2): | 3.04 | |
| Elder Ray (13): | 0.07 | |
| Super Trend (3,10): | 2.89 | |
| Zig ZAG (10): | 3.19 | |
| VORTEX (21): | 1.0700 | |
| Stochastique (14,3,5): | 58.14 | |
| TEMA (21): | 3.15 | |
| Williams %R (14): | -15.15 | |
| Chande Momentum Oscillator (20): | 0.14 | |
| Repulse (5,40,3): | 4.7500 | |
| ROCnROLL: | 1 | |
| TRIX (15,9): | 0.3100 | |
| Courbe Coppock: | 11.80 |
| MA7: | 3.13 | |
| MA20: | 3.00 | |
| MA50: | 2.88 | |
| MA100: | 2.88 | |
| MAexp7: | 3.11 | |
| MAexp20: | 3.02 | |
| MAexp50: | 2.94 | |
| MAexp100: | 2.94 | |
| Price / MA7: | +1.92% | |
| Price / MA20: | +6.33% | |
| Price / MA50: | +10.76% | |
| Price / MA100: | +10.76% | |
| Price / MAexp7: | +2.57% | |
| Price / MAexp20: | +5.63% | |
| Price / MAexp50: | +8.50% | |
| Price / MAexp100: | +8.50% |
News
Don't forget to follow the news on BENFICA. At the time of publication of this analysis, the latest news was as follows:
-
 Benfica and Bayern grasp league titles in nail-biting final match day
- Benfica delegation meets with High Ranking Saudi Arabia Sports Officials and business partners to prepare launch of joint ventures
- Genius Sports Clinches First Live Tracking Data, Analytics, and Enhanced Broadcast Partnership in Portuguese Primeira Liga with S.L. Benfica deal
-
Portuguese Club Benfica Invites Rescued Thai Boys to Train At Soccer Camp
-
360° video: S.L. Benfica's mascot gives eagle's-eye view of the Lisbon stadium
About author
Online


Add a comment
Comments
0 comments on the analysis BENFICA - Daily