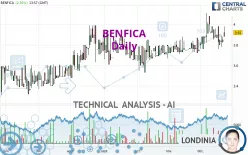
BENFICA - Daily - Technical analysis published on 12/23/2022 (GMT)
- 128
- 0
Click here for a new analysis!
- Timeframe : Daily
- - Analysis generated on
- Status : TARGET REACHED

Summary of the analysis

Additional analysis
Quotes
The BENFICA rating is 3.92 EUR. The price registered an increase of +2.35% on the session and was traded between 3.88 EUR and 3.98 EUR over the period. The price is currently at +1.03% from its lowest and -1.51% from its highest.The Central Gaps scanner detects a bullish opening marking the presence of buyers ahead of sellers at the opening but not sufficiently marked to allow the price to register a quotation gap.
Bullish opening
Type : Bullish
Timeframe : Openning
A study of price movements over other periods shows the following variations:
Near a new LOW record (1 month)
Type : Bearish
Timeframe : Weekly
Technical
A technical analysis in Daily of this BENFICA chart shows a strongly bullish trend. The signals given by the moving averages are 92.86% bullish. This strong bullish trend is confirmed by the strong signals currently being given by short-term moving averages. The Central Indicators market scanner is currently detecting a bullish signal that could impact this trend:
Bullish price crossover with Moving Average 20
Type : Bullish
Timeframe : Daily
In fact, 11 technical indicators on 18 studied are currently positioned bullish. Central Indicators, the detector scanner for these technical indicators has recently detected several signals:
Pivot points : price is over resistance 2
Type : Neutral
Timeframe : Daily
RSI indicator is back over 50
Type : Bullish
Timeframe : Daily
Momentum indicator is back over 0
Type : Bullish
Timeframe : Daily
The Central Patterns scanner, which studies chart patterns, resistances and supports, has identified this signal:
Near support of channel
Type : Bullish
Timeframe : Daily
The Central Candlesticks scanner, specialised in Japanese candlesticks, did not identify any signals.
| S3 | S2 | S1 | Price | R1 | R2 | R3 | |
|---|---|---|---|---|---|---|---|
| ProTrendLines | 3.54 | 3.79 | 3.90 | 3.92 | 4.00 | 4.74 | 5.08 |
| Change (%) | -9.69% | -3.32% | -0.51% | - | +2.04% | +20.92% | +29.59% |
| Change | -0.38 | -0.13 | -0.02 | - | +0.08 | +0.82 | +1.16 |
| Level | Major | Intermediate | Intermediate | - | Intermediate | Intermediate | Minor |
Attention could also be paid to pivot points to set price objectives:
| Pivot points | S3 | S2 | S1 | PP | R1 | R2 | R3 |
|---|---|---|---|---|---|---|---|
| Standard | 3.75 | 3.78 | 3.81 | 3.84 | 3.87 | 3.90 | 3.93 |
| Camarilla | 3.81 | 3.82 | 3.83 | 3.83 | 3.84 | 3.84 | 3.85 |
| Woodie | 3.74 | 3.78 | 3.80 | 3.84 | 3.86 | 3.90 | 3.92 |
| Fibonacci | 3.78 | 3.81 | 3.82 | 3.84 | 3.87 | 3.88 | 3.90 |
| Pivot points | S3 | S2 | S1 | PP | R1 | R2 | R3 |
|---|---|---|---|---|---|---|---|
| Standard | 3.69 | 3.77 | 3.82 | 3.90 | 3.95 | 4.03 | 4.08 |
| Camarilla | 3.83 | 3.85 | 3.86 | 3.87 | 3.88 | 3.89 | 3.91 |
| Woodie | 3.68 | 3.76 | 3.81 | 3.89 | 3.94 | 4.02 | 4.07 |
| Fibonacci | 3.77 | 3.82 | 3.85 | 3.90 | 3.95 | 3.98 | 4.03 |
| Pivot points | S3 | S2 | S1 | PP | R1 | R2 | R3 |
|---|---|---|---|---|---|---|---|
| Standard | 3.51 | 3.61 | 3.68 | 3.78 | 3.85 | 3.95 | 4.02 |
| Camarilla | 3.70 | 3.72 | 3.73 | 3.75 | 3.77 | 3.78 | 3.80 |
| Woodie | 3.50 | 3.60 | 3.67 | 3.77 | 3.84 | 3.94 | 4.01 |
| Fibonacci | 3.61 | 3.68 | 3.72 | 3.78 | 3.85 | 3.89 | 3.95 |
Numerical data
The following are the details of the technical indicators and moving averages that were collected to generate this technical analysis:
| RSI (14): | 57.36 | |
| MACD (12,26,9): | 0.0200 | |
| Directional Movement: | 13.77 | |
| AROON (14): | 14.29 | |
| DEMA (21): | 3.89 | |
| Parabolic SAR (0,02-0,02-0,2): | 4.08 | |
| Elder Ray (13): | 0.06 | |
| Super Trend (3,10): | 3.67 | |
| Zig ZAG (10): | 3.92 | |
| VORTEX (21): | 0.9700 | |
| Stochastique (14,3,5): | 29.52 | |
| TEMA (21): | 3.89 | |
| Williams %R (14): | -54.29 | |
| Chande Momentum Oscillator (20): | 0.03 | |
| Repulse (5,40,3): | -0.7900 | |
| ROCnROLL: | 1 | |
| TRIX (15,9): | 0.1100 | |
| Courbe Coppock: | 1.44 |
| MA7: | 3.86 | |
| MA20: | 3.87 | |
| MA50: | 3.80 | |
| MA100: | 3.78 | |
| MAexp7: | 3.87 | |
| MAexp20: | 3.86 | |
| MAexp50: | 3.82 | |
| MAexp100: | 3.76 | |
| Price / MA7: | +1.55% | |
| Price / MA20: | +1.29% | |
| Price / MA50: | +3.16% | |
| Price / MA100: | +3.70% | |
| Price / MAexp7: | +1.29% | |
| Price / MAexp20: | +1.55% | |
| Price / MAexp50: | +2.62% | |
| Price / MAexp100: | +4.26% |
News
The latest news and videos published on BENFICA at the time of the analysis were as follows:
- Genius Sports Clinches First Live Tracking Data, Analytics, and Enhanced Broadcast Partnership in Portuguese Primeira Liga with S.L. Benfica deal
-
 Portuguese Club Benfica Invites Rescued Thai Boys to Train At Soccer Camp
-
360° video: S.L. Benfica's mascot gives eagle's-eye view of the Lisbon stadium
-
Sport Lisboa e Benfica
-
Sport Lisboa e Benfica
About author
Online


Add a comment
Comments
0 comments on the analysis BENFICA - Daily