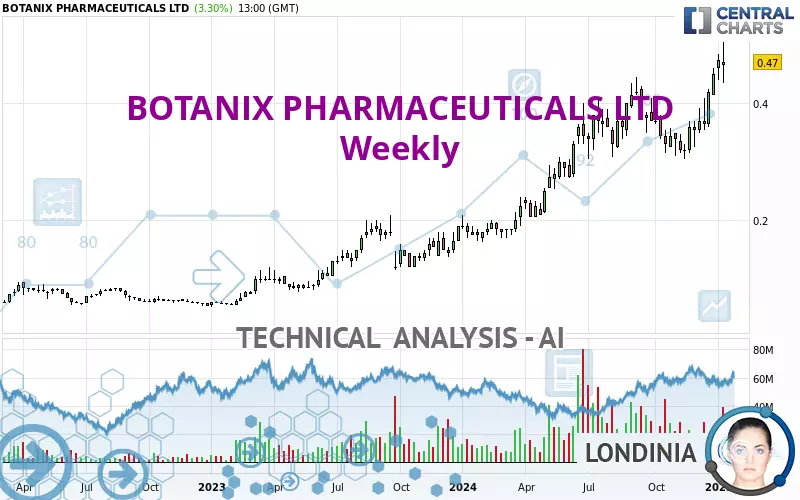
BOTANIX PHARMACEUTICALS LTD - Weekly - Technical analysis published on 01/17/2025 (GMT)
- 105
- 0
Click here for a new analysis!
- Timeframe : Weekly
- - Analysis generated on
- Status : TARGET REACHED

Summary of the analysis

Additional analysis
Quotes
The BOTANIX PHARMACEUTICALS LTD price is 0.470 AUD. The price is up +3.30% over 5 days with the lowest point at 0.435 AUD and the highest point at 0.505 AUD. The deviation from the price is +8.05% for the low point and -6.93% for the high point.So that you have an overall view of the price change, here is a table showing the variations over several periods:
New HIGH record (5 years)
Type : Bullish
Timeframe : Weekly
Technical
A technical analysis in Weekly of this BOTANIX PHARMACEUTICALS LTD chart shows a strongly bullish trend. 92.86% of the signals given by moving averages are bullish. This strongly bullish trend is supported by the strong bullish signals given by short-term moving averages. There is no crossing of moving average by the price or crossing of moving averages between themselves.
In fact, 15 technical indicators on 18 studied are currently bullish. Caution: the Central Indicators scanner currently detects an excess:
RSI indicator is overbought : over 70
Type : Neutral
Timeframe : Weekly
CCI indicator is overbought : over 100
Type : Neutral
Timeframe : Weekly
Previous candle closed over Bollinger bands
Type : Neutral
Timeframe : Weekly
Williams %R indicator is overbought : over -20
Type : Neutral
Timeframe : Weekly
Price is back over the pivot point
Type : Bullish
Timeframe : Weekly
Central Patterns, the scanner specializing in chart patterns, did not identify any signals.
No result was found by the Central Candlesticks scanner on Japanese candlesticks.
| S3 | S2 | S1 | Price | |
|---|---|---|---|---|
| ProTrendLines | 0.270 | 0.310 | 0.435 | 0.470 |
| Change (%) | -42.55% | -34.04% | -7.45% | - |
| Change | -0.200 | -0.160 | -0.035 | - |
| Level | Major | Major | Major | - |
Pivot points can also be used to set your price objectives. Here is the price situation in relation to pivot points:
| Pivot points | S3 | S2 | S1 | PP | R1 | R2 | R3 |
|---|---|---|---|---|---|---|---|
| Standard | 0.438 | 0.447 | 0.458 | 0.467 | 0.478 | 0.487 | 0.498 |
| Camarilla | 0.465 | 0.466 | 0.468 | 0.470 | 0.472 | 0.474 | 0.476 |
| Woodie | 0.440 | 0.448 | 0.460 | 0.468 | 0.480 | 0.488 | 0.500 |
| Fibonacci | 0.447 | 0.454 | 0.459 | 0.467 | 0.474 | 0.479 | 0.487 |
| Pivot points | S3 | S2 | S1 | PP | R1 | R2 | R3 |
|---|---|---|---|---|---|---|---|
| Standard | 0.403 | 0.422 | 0.448 | 0.467 | 0.493 | 0.512 | 0.538 |
| Camarilla | 0.463 | 0.467 | 0.471 | 0.475 | 0.479 | 0.483 | 0.487 |
| Woodie | 0.408 | 0.424 | 0.453 | 0.469 | 0.498 | 0.514 | 0.543 |
| Fibonacci | 0.422 | 0.439 | 0.450 | 0.467 | 0.484 | 0.495 | 0.512 |
| Pivot points | S3 | S2 | S1 | PP | R1 | R2 | R3 |
|---|---|---|---|---|---|---|---|
| Standard | 0.225 | 0.275 | 0.355 | 0.405 | 0.485 | 0.535 | 0.615 |
| Camarilla | 0.399 | 0.411 | 0.423 | 0.435 | 0.447 | 0.459 | 0.471 |
| Woodie | 0.240 | 0.283 | 0.370 | 0.413 | 0.500 | 0.543 | 0.630 |
| Fibonacci | 0.275 | 0.325 | 0.355 | 0.405 | 0.455 | 0.485 | 0.535 |
Numerical data
The following is the status of the technical indicators and moving averages at the time of publication of this technical analysis:
| RSI (14): | 70.68 | |
| MACD (12,26,9): | 0.0330 | |
| Directional Movement: | 20.470 | |
| AROON (14): | 57.143 | |
| DEMA (21): | 0.425 | |
| Parabolic SAR (0,02-0,02-0,2): | 0.334 | |
| Elder Ray (13): | 0.069 | |
| Super Trend (3,10): | 0.330 | |
| Zig ZAG (10): | 0.470 | |
| VORTEX (21): | 1.1040 | |
| Stochastique (14,3,5): | 90.16 | |
| TEMA (21): | 0.430 | |
| Williams %R (14): | -17.50 | |
| Chande Momentum Oscillator (20): | 0.140 | |
| Repulse (5,40,3): | 13.2040 | |
| ROCnROLL: | 1 | |
| TRIX (15,9): | 0.9140 | |
| Courbe Coppock: | 27.16 |
| MA7: | 0.469 | |
| MA20: | 0.434 | |
| MA50: | 0.378 | |
| MA100: | 0.377 | |
| MAexp7: | 0.427 | |
| MAexp20: | 0.384 | |
| MAexp50: | 0.326 | |
| MAexp100: | 0.257 | |
| Price / MA7: | +0.21% | |
| Price / MA20: | +8.29% | |
| Price / MA50: | +24.34% | |
| Price / MA100: | +24.67% | |
| Price / MAexp7: | +10.07% | |
| Price / MAexp20: | +22.40% | |
| Price / MAexp50: | +44.17% | |
| Price / MAexp100: | +82.88% |
About author

Online


Add a comment
Comments
0 comments on the analysis BOTANIX PHARMACEUTICALS LTD - Weekly