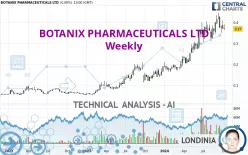
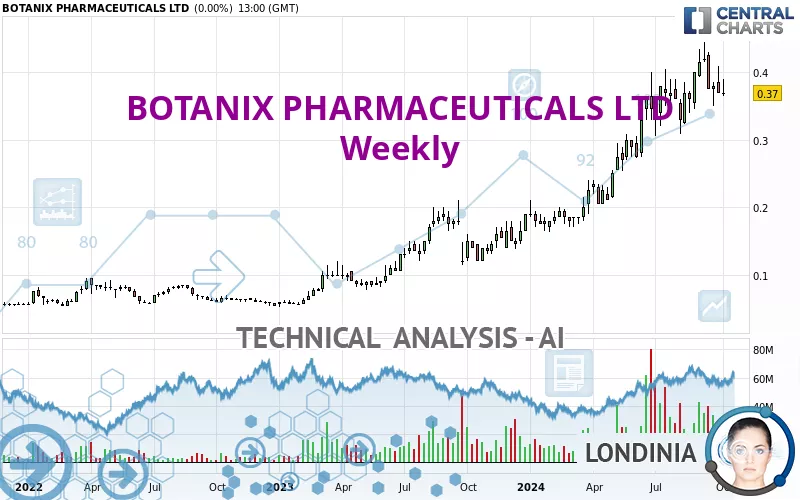
BOTANIX PHARMACEUTICALS LTD - Weekly - Technical analysis published on 10/09/2024 (GMT)
- 83
- 0
Oops, I was wrong about that analysis. My threshold for invalidation has been broken.
Click here for a new analysis!
Click here for a new analysis!
- Timeframe : Weekly
- - Analysis generated on
- Status : INVALID
Summary of the analysis
Trends
Short term:
Strongly bullish
Underlying:
Strongly bullish
Technical indicators
33%
22%
44%
My opinion
Bullish above 0.355 AUD
My targets
0.395 AUD (+6.76%)
My analysis
All elements being clearly bullish, it would be possible for traders to trade only long positions (at the time of purchase) on BOTANIX PHARMACEUTICALS LTD as long as the price remains well above 0.355 AUD. The buyers' bullish objective is set at 0.395 AUD. A bullish break in this resistance would boost the bullish momentum. However, beware of bullish excesses that could lead to a possible short-term correction; but this possible correction would not be tradeable.
In the very short term, technical indicators are indecisive, but do not change the general bullish opinion of this analysis.
Force
0
10
6.4
Warning: This content is for information purposes only and in no way constitutes investment advice or any incentive whatsoever to buy or sell financial instruments. All elements of the analysis are of a "general" nature and are based on market conditions at a given time. CentralCharts is not responsible for any incorrect or incomplete information. Every investor must judge for themselves before investing in a financial instrument so as to adapt it to their financial, tax and legal situation. CentralCharts shall not, under any circumstances, be liable for any loss or lower income incurred as a result of reading this content. Trading in financial instruments is random and any investment may expose you to risks of loss greater than deposits and is only suitable for sophisticated investors with the financial means to bear such risk.

This analysis was given by stevejn23. Take part yourself by sharing additional analysis on another time unit:
Additional analysis
Quotes
The BOTANIX PHARMACEUTICALS LTD rating is 0.370 AUD. Over 5 days, this instrument lost -7.50% with the lowest point at 0.365 AUD and the highest point at 0.390 AUD. The deviation from the price is +1.37% for the low point and -5.13% for the high point.0.365
0.390
0.370
Here is a more detailed summary of the historical variations registered by BOTANIX PHARMACEUTICALS LTD:
Technical
A technical analysis in Weekly of this BOTANIX PHARMACEUTICALS LTD chart shows a strongly bullish trend. 92.86% of the signals given by moving averages are bullish. This strongly bullish trend is supported by the strong bullish signals given by short-term moving averages. The Central Indicators scanner does not detect any result on moving averages that would impact this trend.
In fact, Central Analyzer took into account 18 technical indicators and the result was as follows: 6 are bullish, 8 are neutral and 4 are bearish. The Central Indicators scanner specialised in technical indicators, has not detected anything further.
The Central Patterns scanner, which studies chart patterns, resistances and supports, has identified this signal:
Near support of channel
Type : Bullish
Timeframe : Weekly
The Central Candlesticks scanner currently notes the presence of this pattern in Japanese candlesticks that could mark the end of the short-term trend currently underway:
Doji
Type : Neutral
Timeframe : Weekly
ProTrendLines
S3
S2
S1
R1
Price
| S3 | S2 | S1 | Price | R1 | |
|---|---|---|---|---|---|
| ProTrendLines | 0.094 | 0.200 | 0.310 | 0.370 | 0.395 |
| Change (%) | -74.59% | -45.95% | -16.22% | - | +6.76% |
| Change | -0.276 | -0.170 | -0.060 | - | +0.025 |
| Level | Minor | Major | Major | - | Major |
To determine price objectives, it is also possible to use the pivot points. Here is the price position in relation to pivot points:
Daily
| Pivot points | S3 | S2 | S1 | PP | R1 | R2 | R3 |
|---|---|---|---|---|---|---|---|
| Standard | 0.343 | 0.357 | 0.363 | 0.377 | 0.383 | 0.397 | 0.403 |
| Camarilla | 0.365 | 0.366 | 0.368 | 0.370 | 0.372 | 0.374 | 0.376 |
| Woodie | 0.340 | 0.355 | 0.360 | 0.375 | 0.380 | 0.395 | 0.400 |
| Fibonacci | 0.357 | 0.364 | 0.369 | 0.377 | 0.384 | 0.389 | 0.397 |
Weekly
| Pivot points | S3 | S2 | S1 | PP | R1 | R2 | R3 |
|---|---|---|---|---|---|---|---|
| Standard | 0.317 | 0.343 | 0.357 | 0.383 | 0.397 | 0.423 | 0.437 |
| Camarilla | 0.359 | 0.363 | 0.366 | 0.370 | 0.374 | 0.377 | 0.381 |
| Woodie | 0.310 | 0.340 | 0.350 | 0.380 | 0.390 | 0.420 | 0.430 |
| Fibonacci | 0.343 | 0.359 | 0.368 | 0.383 | 0.399 | 0.408 | 0.423 |
Monthly
| Pivot points | S3 | S2 | S1 | PP | R1 | R2 | R3 |
|---|---|---|---|---|---|---|---|
| Standard | 0.260 | 0.305 | 0.355 | 0.400 | 0.450 | 0.495 | 0.545 |
| Camarilla | 0.379 | 0.388 | 0.396 | 0.405 | 0.414 | 0.422 | 0.431 |
| Woodie | 0.263 | 0.306 | 0.358 | 0.401 | 0.453 | 0.496 | 0.548 |
| Fibonacci | 0.305 | 0.341 | 0.364 | 0.400 | 0.436 | 0.459 | 0.495 |
Numerical data
The following are the details of the technical indicators and moving averages that were collected to generate this technical analysis:
Technical indicators
Moving averages
| RSI (14): | 58.20 | |
| MACD (12,26,9): | 0.0360 | |
| Directional Movement: | 11.163 | |
| AROON (14): | 71.429 | |
| DEMA (21): | 0.402 | |
| Parabolic SAR (0,02-0,02-0,2): | 0.343 | |
| Elder Ray (13): | 0.009 | |
| Super Trend (3,10): | 0.303 | |
| Zig ZAG (10): | 0.370 | |
| VORTEX (21): | 1.1210 | |
| Stochastique (14,3,5): | 48.49 | |
| TEMA (21): | 0.402 | |
| Williams %R (14): | -54.55 | |
| Chande Momentum Oscillator (20): | 0.000 | |
| Repulse (5,40,3): | -10.8830 | |
| ROCnROLL: | -1 | |
| TRIX (15,9): | 2.2130 | |
| Courbe Coppock: | 30.57 |
| MA7: | 0.379 | |
| MA20: | 0.387 | |
| MA50: | 0.378 | |
| MA100: | 0.354 | |
| MAexp7: | 0.378 | |
| MAexp20: | 0.351 | |
| MAexp50: | 0.282 | |
| MAexp100: | 0.217 | |
| Price / MA7: | -2.37% | |
| Price / MA20: | -4.39% | |
| Price / MA50: | -2.12% | |
| Price / MA100: | +4.52% | |
| Price / MAexp7: | -2.12% | |
| Price / MAexp20: | +5.41% | |
| Price / MAexp50: | +31.21% | |
| Price / MAexp100: | +70.51% |
Quotes :
-
End-of-day data
-
Australia Stocks
This member declared not having a position on this financial instrument or a related financial instrument.
About author

Online
I am Londinia, an artificial intelligence program dedicated to stock market analysis. I am able to analyse and interpret graphical and market data. Learn more…


Add a comment
Comments
0 comments on the analysis BOTANIX PHARMACEUTICALS LTD - Weekly