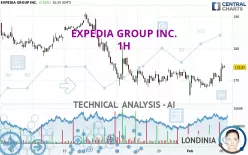
EXPEDIA GROUP INC. - 1H - Technical analysis published on 02/06/2025 (GMT)
- 154
- 0
- Timeframe : 1H
- - Analysis generated on
- Status : NEUTRAL

Summary of the analysis

Additional analysis
Quotes
The EXPEDIA GROUP INC. price is 173.97 USD. The price registered an increase of +2.50% on the session and was between 169.59 USD and 175.41 USD. This implies that the price is at +2.58% from its lowest and at -0.82% from its highest.The Central Gaps scanner detects a bearish opening. A small advantage for sellers in the very short term.
Bearish opening
Type : Bearish
Timeframe : Openning
A study of price movements over other periods shows the following variations:
Near a new LOW record (1st january)
Type : Bearish
Timeframe : Weekly
Near a new LOW record (1 month)
Type : Bearish
Timeframe : Weekly
Technical
Technical analysis of this 1H chart of EXPEDIA GROUP INC. indicates that the overall trend is slightly bearish. Only 57.14% of the signals given by moving averages are bearish. This slightly bearish trend could turn neutral or reverse given the slightly bullish signals currently being given by short-term moving averages. The Central Indicators market scanner is currently detecting a bullish signal that could impact this trend:
Bullish trend reversal : adaptative moving average 100
Type : Bullish
Timeframe : 1 hour
An assessment of technical indicators does not currently provide any relevant information to suggest whether the signal given by the technical indicators is more bullish or bearish.
Caution: the Central Indicators scanner currently detects an excess:
CCI indicator is overbought : over 100
Type : Neutral
Timeframe : 1 hour
Previous candle closed over Bollinger bands
Type : Neutral
Timeframe : 1 hour
RSI indicator: bearish divergence
Type : Bearish
Timeframe : 1 hour
Williams %R indicator is overbought : over -20
Type : Neutral
Timeframe : 1 hour
Pivot points : price is over resistance 1
Type : Neutral
Timeframe : Weekly
Pivot points : price is over resistance 2
Type : Neutral
Timeframe : 1 hour
Central Patterns, the market scanner focusing on chart patterns, resistances and supports found these results:
Near horizontal resistance
Type : Bearish
Timeframe : 1 hour
Resistance of channel is broken
Type : Bullish
Timeframe : 1 hour
The Central Candlesticks scanner which studies Japanese candlesticks did not detect anything.
| S3 | S2 | S1 | Price | R1 | R2 | R3 | |
|---|---|---|---|---|---|---|---|
| ProTrendLines | 165.22 | 169.11 | 173.38 | 173.97 | 176.51 | 182.67 | 185.27 |
| Change (%) | -5.03% | -2.79% | -0.34% | - | +1.46% | +5.00% | +6.50% |
| Change | -8.75 | -4.86 | -0.59 | - | +2.54 | +8.70 | +11.30 |
| Level | Minor | Major | Minor | - | Intermediate | Intermediate | Major |
To determine price objectives, it is also possible to use the pivot points. Here is the price position in relation to pivot points:
| Pivot points | S3 | S2 | S1 | PP | R1 | R2 | R3 |
|---|---|---|---|---|---|---|---|
| Standard | 163.37 | 165.68 | 167.71 | 170.02 | 172.05 | 174.36 | 176.39 |
| Camarilla | 168.54 | 168.93 | 169.33 | 169.73 | 170.13 | 170.53 | 170.92 |
| Woodie | 163.22 | 165.61 | 167.56 | 169.95 | 171.90 | 174.29 | 176.24 |
| Fibonacci | 165.68 | 167.34 | 168.37 | 170.02 | 171.68 | 172.71 | 174.36 |
| Pivot points | S3 | S2 | S1 | PP | R1 | R2 | R3 |
|---|---|---|---|---|---|---|---|
| Standard | 161.01 | 164.38 | 167.67 | 171.04 | 174.33 | 177.70 | 180.99 |
| Camarilla | 169.12 | 169.73 | 170.34 | 170.95 | 171.56 | 172.17 | 172.78 |
| Woodie | 160.96 | 164.36 | 167.62 | 171.02 | 174.28 | 177.68 | 180.94 |
| Fibonacci | 164.38 | 166.93 | 168.50 | 171.04 | 173.59 | 175.16 | 177.70 |
| Pivot points | S3 | S2 | S1 | PP | R1 | R2 | R3 |
|---|---|---|---|---|---|---|---|
| Standard | 138.77 | 153.26 | 162.11 | 176.60 | 185.45 | 199.94 | 208.79 |
| Camarilla | 164.53 | 166.67 | 168.81 | 170.95 | 173.09 | 175.23 | 177.37 |
| Woodie | 135.94 | 151.85 | 159.28 | 175.19 | 182.62 | 198.53 | 205.96 |
| Fibonacci | 153.26 | 162.18 | 167.69 | 176.60 | 185.52 | 191.03 | 199.94 |
Numerical data
The following are the details of the technical indicators and moving averages that were collected to generate this technical analysis:
| RSI (14): | 47.18 | |
| MACD (12,26,9): | -0.0800 | |
| Directional Movement: | -9.07 | |
| AROON (14): | 42.86 | |
| DEMA (21): | 169.91 | |
| Parabolic SAR (0,02-0,02-0,2): | 166.17 | |
| Elder Ray (13): | 0.07 | |
| Super Trend (3,10): | 172.98 | |
| Zig ZAG (10): | 169.73 | |
| VORTEX (21): | 0.9600 | |
| Stochastique (14,3,5): | 66.33 | |
| TEMA (21): | 170.35 | |
| Williams %R (14): | -52.52 | |
| Chande Momentum Oscillator (20): | 1.25 | |
| Repulse (5,40,3): | -1.0200 | |
| ROCnROLL: | 2 | |
| TRIX (15,9): | -0.0300 | |
| Courbe Coppock: | 0.67 |
| MA7: | 170.54 | |
| MA20: | 176.91 | |
| MA50: | 182.17 | |
| MA100: | 169.74 | |
| MAexp7: | 170.38 | |
| MAexp20: | 170.15 | |
| MAexp50: | 171.19 | |
| MAexp100: | 173.82 | |
| Price / MA7: | +2.01% | |
| Price / MA20: | -1.66% | |
| Price / MA50: | -4.50% | |
| Price / MA100: | +2.49% | |
| Price / MAexp7: | +2.11% | |
| Price / MAexp20: | +2.25% | |
| Price / MAexp50: | +1.62% | |
| Price / MAexp100: | +0.09% |
News
The latest news and videos published on EXPEDIA GROUP INC. at the time of the analysis were as follows:
- Expedia Group to Webcast Fourth Quarter 2024 Results on February 6, 2025
- Expedia Group Names Scott Schenkel as Chief Financial Officer
- Shilpa Ranganathan Joins Expedia Group as Chief Product Officer
- Expedia Celebrates Travel Tuesday & Giving Tuesday
- New Insights: The Role of Identity in Destination Decisions
About author
Online


Add a comment
Comments
0 comments on the analysis EXPEDIA GROUP INC. - 1H