| Open: | 6.9083 |
| Change: | +0.0030 |
| Volume: | 33,833 |
| Low: | 6.9083 |
| High: | 6.9202 |
| High / Low range: | 0.0119 |
| Type: | Stocks |
| Ticker: | EXPE |
| ISIN: |
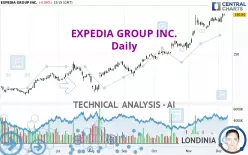
EXPEDIA GROUP INC. - Daily - Technical analysis published on 12/06/2024 (GMT)
- 131
- 0
- 12/06/2024 - 19:35
Click here for a new analysis!
- Timeframe : Daily
- - Analysis generated on 12/06/2024 - 19:35
- Status : INVALID

Summary of the analysis

Additional analysis
Quotes
EXPEDIA GROUP INC. rating 190.90 USD. The price registered a decrease of -0.06% on the session with the lowest point at 189.48 USD and the highest point at 192.00 USD. The deviation from the price is +0.75% for the low point and -0.57% for the high point.A study of price movements over other periods shows the following variations:
Near a new HIGH record (1 year)
Type : Bullish
Timeframe : Weekly
Near a new HIGH record (1st january)
Type : Bullish
Timeframe : Weekly
Near a new HIGH record (1 month)
Type : Bullish
Timeframe : Weekly
Technical
A technical analysis in Daily of this EXPEDIA GROUP INC. chart shows a strongly bullish trend. 92.86% of the signals given by moving averages are bullish. This strongly bullish trend is supported by the strong bullish signals given by short-term moving averages. The Central Indicators market scanner currently does not detect any result that concerns moving averages.
Technical indicators are strongly bullish, suggesting that the price increase should continue.
Caution: the Central Indicators scanner currently detects an excess:
RSI indicator is overbought : over 70
Type : Neutral
Timeframe : Daily
CCI indicator is overbought : over 100
Type : Neutral
Timeframe : Daily
Previous candle closed over Bollinger bands
Type : Neutral
Timeframe : Daily
Williams %R indicator is overbought : over -20
Type : Neutral
Timeframe : Daily
Pivot points : price is over resistance 1
Type : Neutral
Timeframe : Weekly
The Central Patterns scanner, which studies chart patterns, resistances and supports, has identified this signal:
Near support of channel
Type : Bullish
Timeframe : Daily
No result was found by the Central Candlesticks scanner on Japanese candlesticks.
| S3 | S2 | S1 | Price | R1 | R2 | |
|---|---|---|---|---|---|---|
| ProTrendLines | 154.76 | 163.17 | 185.27 | 190.90 | 198.20 | 213.80 |
| Change (%) | -18.93% | -14.53% | -2.95% | - | +3.82% | +12.00% |
| Change | -36.14 | -27.73 | -5.63 | - | +7.30 | +22.90 |
| Level | Major | Intermediate | Major | - | Minor | Major |
Attention could also be paid to pivot points to set price objectives:
| Pivot points | S3 | S2 | S1 | PP | R1 | R2 | R3 |
|---|---|---|---|---|---|---|---|
| Standard | 183.22 | 185.28 | 188.15 | 190.21 | 193.08 | 195.14 | 198.01 |
| Camarilla | 189.65 | 190.11 | 190.56 | 191.01 | 191.46 | 191.91 | 192.37 |
| Woodie | 183.62 | 185.48 | 188.55 | 190.41 | 193.48 | 195.34 | 198.41 |
| Fibonacci | 185.28 | 187.17 | 188.33 | 190.21 | 192.10 | 193.26 | 195.14 |
| Pivot points | S3 | S2 | S1 | PP | R1 | R2 | R3 |
|---|---|---|---|---|---|---|---|
| Standard | 177.18 | 180.19 | 182.41 | 185.42 | 187.64 | 190.65 | 192.87 |
| Camarilla | 183.18 | 183.66 | 184.14 | 184.62 | 185.10 | 185.58 | 186.06 |
| Woodie | 176.78 | 179.99 | 182.01 | 185.22 | 187.24 | 190.45 | 192.47 |
| Fibonacci | 180.19 | 182.19 | 183.43 | 185.42 | 187.42 | 188.66 | 190.65 |
| Pivot points | S3 | S2 | S1 | PP | R1 | R2 | R3 |
|---|---|---|---|---|---|---|---|
| Standard | 129.25 | 142.63 | 163.63 | 177.01 | 198.01 | 211.39 | 232.39 |
| Camarilla | 175.17 | 178.32 | 181.47 | 184.62 | 187.77 | 190.92 | 194.08 |
| Woodie | 133.05 | 144.54 | 167.43 | 178.92 | 201.81 | 213.30 | 236.19 |
| Fibonacci | 142.63 | 155.77 | 163.88 | 177.01 | 190.15 | 198.26 | 211.39 |
Numerical data
The following is the status of technical indicators and moving averages registered at the time this technical analysis was created:
| RSI (14): | 71.78 | |
| MACD (12,26,9): | 6.3400 | |
| Directional Movement: | 24.36 | |
| AROON (14): | 78.57 | |
| DEMA (21): | 190.64 | |
| Parabolic SAR (0,02-0,02-0,2): | 176.53 | |
| Elder Ray (13): | 5.70 | |
| Super Trend (3,10): | 178.24 | |
| Zig ZAG (10): | 190.56 | |
| VORTEX (21): | 1.1200 | |
| Stochastique (14,3,5): | 93.45 | |
| TEMA (21): | 190.67 | |
| Williams %R (14): | -10.83 | |
| Chande Momentum Oscillator (20): | 13.53 | |
| Repulse (5,40,3): | 1.8400 | |
| ROCnROLL: | 1 | |
| TRIX (15,9): | 0.5700 | |
| Courbe Coppock: | 8.36 |
| MA7: | 186.88 | |
| MA20: | 183.72 | |
| MA50: | 167.16 | |
| MA100: | 149.94 | |
| MAexp7: | 187.56 | |
| MAexp20: | 181.88 | |
| MAexp50: | 169.41 | |
| MAexp100: | 156.90 | |
| Price / MA7: | +2.15% | |
| Price / MA20: | +3.91% | |
| Price / MA50: | +14.20% | |
| Price / MA100: | +27.32% | |
| Price / MAexp7: | +1.78% | |
| Price / MAexp20: | +4.96% | |
| Price / MAexp50: | +12.69% | |
| Price / MAexp100: | +21.67% |
News
The latest news and videos published on EXPEDIA GROUP INC. at the time of the analysis were as follows:
- 12/05/2024 - 13:45 Expedia Celebrates Travel Tuesday & Giving Tuesday
- 10/31/2024 - 11:05 New Insights: The Role of Identity in Destination Decisions
- 10/30/2024 - 15:55 Inclusive Travel Principles for Vacation Rental Hosts
- 10/17/2024 - 15:10 Expedia Group Welcomes Ramana Thumu as Chief Technology Officer
- 10/16/2024 - 13:02 UNPACK '25: THE TRENDS IN TRAVEL FROM EXPEDIA, HOTELS.COM AND VRBO
About author
Online


Add a comment
Comments
0 comments on the analysis EXPEDIA GROUP INC. - Daily