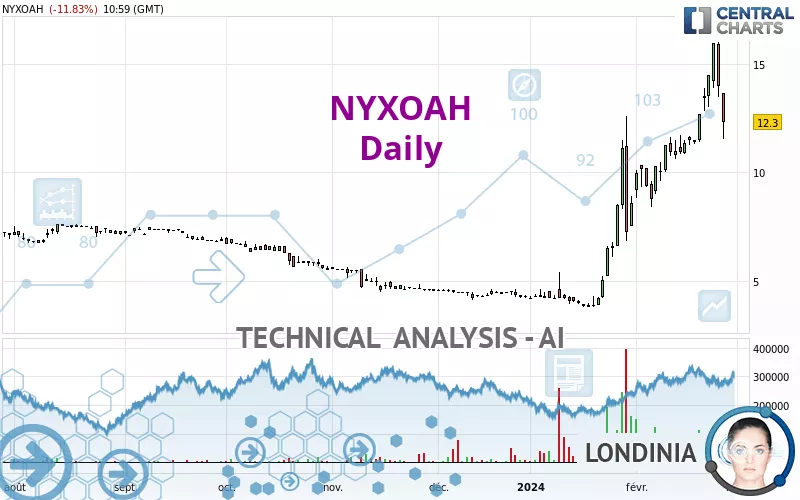
NYXOAH - Daily - Technical analysis published on 02/27/2024 (GMT)
- 139
- 0
Click here for a new analysis!
- Timeframe : Daily
- - Analysis generated on
- Status : TARGET REACHED
Summary of the analysis

Additional analysis
Quotes
The NYXOAH rating is 12.30 EUR. The price registered a decrease of -11.83% on the session and was between 11.55 EUR and 13.65 EUR. This implies that the price is at +6.49% from its lowest and at -9.89% from its highest.The Central Gaps scanner detects a bearish opening marking the presence of sellers ahead of buyers at the opening but not sufficiently marked to allow the price to register a quotation gap.
Bearish opening
Type : Bearish
Timeframe : Openning
So that you have an overall view of the price change, here is a table showing the variations over several periods:
Abnormal volumes
Timeframe : 5 days
Abnormal volumes
Timeframe : 20 days
Abnormal volumes
Timeframe : 50 days
Technical
Technical analysis of NYXOAH in Daily shows a strongly overall bullish trend. 92.86% of the signals given by moving averages are bullish. This strongly bullish trend is supported by the strong bullish signals given by short-term moving averages. The Central Indicators market scanner currently does not detect any result that concerns moving averages.
An assessment of technical indicators does not currently provide any relevant information on the direction of future price movements.
Central Indicators, the scanner specialised in technical indicators, has identified these signals:
Pivot points : price is under support 1
Type : Neutral
Timeframe : Daily
Pivot points : price is under support 1
Type : Neutral
Timeframe : Weekly
Williams %R indicator is back under -50
Type : Bearish
Timeframe : Daily
An analysis of the price chart with the Central Patterns scanner (detector of chart patterns and resistances and supports) shows a result that can have an impact on the price change:
Near support of channel
Type : Bullish
Timeframe : Daily
No result was found by the Central Candlesticks scanner on Japanese candlesticks.
| S3 | S2 | S1 | Price | R1 | R2 | R3 | |
|---|---|---|---|---|---|---|---|
| ProTrendLines | 6.72 | 7.65 | 11.25 | 12.30 | 13.53 | 15.92 | 18.42 |
| Change (%) | -45.37% | -37.80% | -8.54% | - | +10.00% | +29.43% | +49.76% |
| Change | -5.58 | -4.65 | -1.05 | - | +1.23 | +3.62 | +6.12 |
| Level | Major | Major | Intermediate | - | Intermediate | Intermediate | Minor |
Attention could also be paid to pivot points to set price objectives:
| Pivot points | S3 | S2 | S1 | PP | R1 | R2 | R3 |
|---|---|---|---|---|---|---|---|
| Standard | 10.38 | 11.92 | 12.93 | 14.47 | 15.48 | 17.02 | 18.03 |
| Camarilla | 13.25 | 13.48 | 13.72 | 13.95 | 14.18 | 14.42 | 14.65 |
| Woodie | 10.13 | 11.79 | 12.68 | 14.34 | 15.23 | 16.89 | 17.78 |
| Fibonacci | 11.92 | 12.89 | 13.49 | 14.47 | 15.44 | 16.04 | 17.02 |
| Pivot points | S3 | S2 | S1 | PP | R1 | R2 | R3 |
|---|---|---|---|---|---|---|---|
| Standard | 8.20 | 9.75 | 12.85 | 14.40 | 17.50 | 19.05 | 22.15 |
| Camarilla | 14.67 | 15.10 | 15.52 | 15.95 | 16.38 | 16.80 | 17.23 |
| Woodie | 8.98 | 10.14 | 13.63 | 14.79 | 18.28 | 19.44 | 22.93 |
| Fibonacci | 9.75 | 11.53 | 12.62 | 14.40 | 16.18 | 17.27 | 19.05 |
| Pivot points | S3 | S2 | S1 | PP | R1 | R2 | R3 |
|---|---|---|---|---|---|---|---|
| Standard | -4.75 | -0.48 | 4.06 | 8.33 | 12.87 | 17.14 | 21.68 |
| Camarilla | 6.18 | 6.99 | 7.79 | 8.60 | 9.41 | 10.22 | 11.02 |
| Woodie | -4.62 | -0.41 | 4.20 | 8.40 | 13.01 | 17.21 | 21.82 |
| Fibonacci | -0.48 | 2.89 | 4.97 | 8.33 | 11.70 | 13.78 | 17.14 |
Numerical data
The following are the details of the technical indicators and moving averages that were collected to generate this technical analysis:
| RSI (14): | 56.92 | |
| MACD (12,26,9): | 1.8500 | |
| Directional Movement: | 18.02 | |
| AROON (14): | 92.86 | |
| DEMA (21): | 13.85 | |
| Parabolic SAR (0,02-0,02-0,2): | 10.23 | |
| Elder Ray (13): | 0.20 | |
| Super Trend (3,10): | 11.41 | |
| Zig ZAG (10): | 12.20 | |
| VORTEX (21): | 1.0700 | |
| Stochastique (14,3,5): | 70.47 | |
| TEMA (21): | 14.48 | |
| Williams %R (14): | -59.37 | |
| Chande Momentum Oscillator (20): | 0.95 | |
| Repulse (5,40,3): | -11.0400 | |
| ROCnROLL: | -1 | |
| TRIX (15,9): | 3.3200 | |
| Courbe Coppock: | 76.30 |
| MA7: | 13.44 | |
| MA20: | 11.42 | |
| MA50: | 7.49 | |
| MA100: | 6.38 | |
| MAexp7: | 13.22 | |
| MAexp20: | 11.43 | |
| MAexp50: | 8.83 | |
| MAexp100: | 7.48 | |
| Price / MA7: | -8.48% | |
| Price / MA20: | +7.71% | |
| Price / MA50: | +64.22% | |
| Price / MA100: | +92.79% | |
| Price / MAexp7: | -6.96% | |
| Price / MAexp20: | +7.61% | |
| Price / MAexp50: | +39.30% | |
| Price / MAexp100: | +64.44% |
News
The latest news and videos published on NYXOAH at the time of the analysis were as follows:
- Nyxoah Announces 2024 Strategic Priorities
- Nyxoah Announces Real World Case Series Demonstrating Positive Results in Treating CCC Patients with Genio®
- Nyxoah to Participate in the Piper Sandler 35th Annual Healthcare Conference
- Nyxoah Reports Third Quarter 2023 Financial and Operating Results
- Nyxoah Announces Partnership with ResMed in Germany
About author

Online


Add a comment
Comments
0 comments on the analysis NYXOAH - Daily