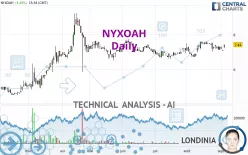
NYXOAH - Daily - Technical analysis published on 09/06/2023 (GMT)
- 171
- 0
Click here for a new analysis!
- Timeframe : Daily
- - Analysis generated on
- Status : INVALID

Summary of the analysis

Additional analysis
Quotes
The NYXOAH rating is 7.44 EUR. The price has increased by +4.49% since the last closing and was between 7.22 EUR and 7.44 EUR. This implies that the price is at +3.05% from its lowest and at 0% from its highest.A bullish gap was detected at the opening by the Central Gaps scanner. There are a lot of buyers and they have the upper hand in the very short term.
Opening Gap UP
Type : Bullish
Timeframe : Openning
So that you have an overall view of the price change, here is a table showing the variations over several periods:
Near a new HIGH record (1 month)
Type : Bullish
Timeframe : Weekly
Technical
Technical analysis of NYXOAH in Daily shows an overall bullish trend. The signals returned by the moving averages are 78.57% bullish. This bullish trend is reinforced by the strong signals currently being given by short-term moving averages. The Central Indicators scanner detects bullish signals on moving averages that could impact this trend:
Bullish price crossover with Moving Average 20
Type : Bullish
Timeframe : Daily
Bullish price crossover with Moving Average 100
Type : Bullish
Timeframe : Daily
Bullish price crossover with adaptative moving average 20
Type : Bullish
Timeframe : Daily
Bullish price crossover with adaptative moving average 50
Type : Bullish
Timeframe : Daily
In fact, 10 technical indicators on 18 studied are currently positioned bullish. Other results related to technical indicators were also found by the Central Indicators scanner:
Pivot points : price is over resistance 1
Type : Neutral
Timeframe : Weekly
Pivot points : price is over resistance 3
Type : Neutral
Timeframe : Daily
RSI indicator is back over 50
Type : Bullish
Timeframe : Daily
Ichimoku : price is over the cloud
Type : Bullish
Timeframe : Daily
Williams %R indicator is back over -50
Type : Bullish
Timeframe : Daily
An analysis of the price chart with the Central Patterns scanner (detector of chart patterns and resistances and supports) shows several results that can have an impact on the price change:
Near horizontal resistance
Type : Bearish
Timeframe : Daily
Near resistance of channel
Type : Bearish
Timeframe : Daily
Resistance of triangle is broken
Type : Bullish
Timeframe : Daily
Central Candlesticks, the scanner specialised in Japanese candlesticks, detects a bullish signal that could support the hypothesis of a small rebound in the very short term:
Upside gap
Type : Bullish
Timeframe : Daily
| S3 | S2 | S1 | Price | R1 | R2 | R3 | |
|---|---|---|---|---|---|---|---|
| ProTrendLines | 5.72 | 6.71 | 7.19 | 7.44 | 7.61 | 8.74 | 18.42 |
| Change (%) | -23.12% | -9.81% | -3.36% | - | +2.28% | +17.47% | +147.58% |
| Change | -1.72 | -0.73 | -0.25 | - | +0.17 | +1.30 | +10.98 |
| Level | Minor | Intermediate | Minor | - | Intermediate | Intermediate | Minor |
Attention could also be paid to pivot points to set price objectives:
| Pivot points | S3 | S2 | S1 | PP | R1 | R2 | R3 |
|---|---|---|---|---|---|---|---|
| Standard | 7.07 | 7.15 | 7.29 | 7.37 | 7.51 | 7.59 | 7.73 |
| Camarilla | 7.38 | 7.40 | 7.42 | 7.44 | 7.46 | 7.48 | 7.50 |
| Woodie | 7.11 | 7.17 | 7.33 | 7.39 | 7.55 | 7.61 | 7.77 |
| Fibonacci | 7.15 | 7.23 | 7.28 | 7.37 | 7.45 | 7.50 | 7.59 |
| Pivot points | S3 | S2 | S1 | PP | R1 | R2 | R3 |
|---|---|---|---|---|---|---|---|
| Standard | 6.84 | 6.98 | 7.14 | 7.28 | 7.44 | 7.58 | 7.74 |
| Camarilla | 7.22 | 7.25 | 7.27 | 7.30 | 7.33 | 7.36 | 7.38 |
| Woodie | 6.85 | 6.99 | 7.15 | 7.29 | 7.45 | 7.59 | 7.75 |
| Fibonacci | 6.98 | 7.10 | 7.17 | 7.28 | 7.40 | 7.47 | 7.58 |
| Pivot points | S3 | S2 | S1 | PP | R1 | R2 | R3 |
|---|---|---|---|---|---|---|---|
| Standard | 5.91 | 6.31 | 6.81 | 7.21 | 7.71 | 8.11 | 8.61 |
| Camarilla | 7.05 | 7.14 | 7.22 | 7.30 | 7.38 | 7.47 | 7.55 |
| Woodie | 5.95 | 6.34 | 6.85 | 7.24 | 7.75 | 8.14 | 8.65 |
| Fibonacci | 6.31 | 6.66 | 6.87 | 7.21 | 7.56 | 7.77 | 8.11 |
Numerical data
The following are the details of the technical indicators and moving averages that were collected to generate this technical analysis:
| RSI (14): | 55.62 | |
| MACD (12,26,9): | 0.0400 | |
| Directional Movement: | 8.68 | |
| AROON (14): | -28.57 | |
| DEMA (21): | 7.35 | |
| Parabolic SAR (0,02-0,02-0,2): | 7.53 | |
| Elder Ray (13): | 0.03 | |
| Super Trend (3,10): | 6.92 | |
| Zig ZAG (10): | 7.44 | |
| VORTEX (21): | 1.0200 | |
| Stochastique (14,3,5): | 44.44 | |
| TEMA (21): | 7.34 | |
| Williams %R (14): | -30.00 | |
| Chande Momentum Oscillator (20): | -0.04 | |
| Repulse (5,40,3): | 4.8100 | |
| ROCnROLL: | 1 | |
| TRIX (15,9): | 0.1500 | |
| Courbe Coppock: | 2.11 |
| MA7: | 7.29 | |
| MA20: | 7.35 | |
| MA50: | 7.11 | |
| MA100: | 7.23 | |
| MAexp7: | 7.30 | |
| MAexp20: | 7.28 | |
| MAexp50: | 7.19 | |
| MAexp100: | 7.03 | |
| Price / MA7: | +2.06% | |
| Price / MA20: | +1.22% | |
| Price / MA50: | +4.64% | |
| Price / MA100: | +2.90% | |
| Price / MAexp7: | +1.92% | |
| Price / MAexp20: | +2.20% | |
| Price / MAexp50: | +3.48% | |
| Price / MAexp100: | +5.83% |
News
The last news published on NYXOAH at the time of the generation of this analysis was as follows:
- Nyxoah Reports Second Quarter and First Half 2023 Financial and Operating Results
- Nyxoah to Participate in the 43rd Canaccord Genuity Growth Conference
- Nyxoah Reports First Quarter 2023 Financial and Operating Results
- Invitation to Attend the Annual Shareholders’ Meeting of the Company to be Held on June 14, 2023
- Nyxoah Appoints Christoph Eigenmann as Chief Commercial Officer
About author
Online


Add a comment
Comments
0 comments on the analysis NYXOAH - Daily