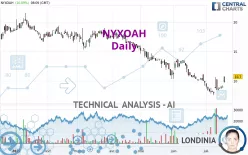
NYXOAH - Daily - Technical analysis published on 07/19/2022 (GMT)
- 191
- 0
Click here for a new analysis!
- Timeframe : Daily
- - Analysis generated on
- Status : LEVEL MAINTAINED
Summary of the analysis

Additional analysis
Quotes
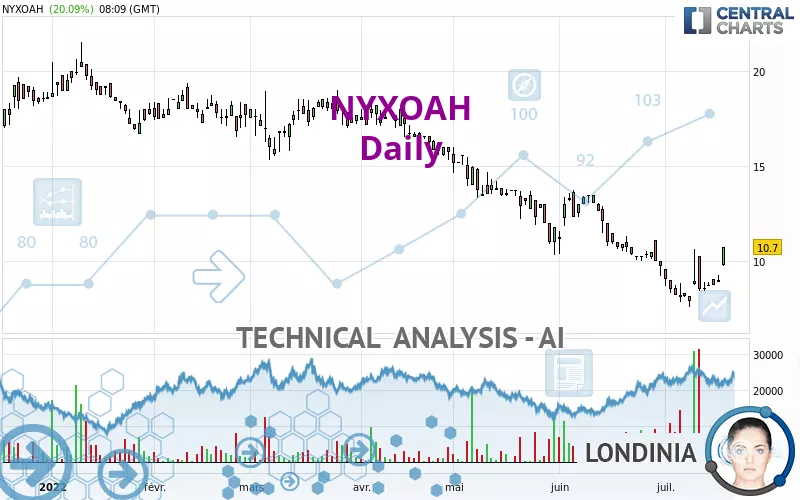
The NYXOAH rating is 10.70 EUR. The price has increased by +20.09% since the last closing with the lowest point at 9.74 EUR and the highest point at 10.70 EUR. The deviation from the price is +9.86% for the low point and 0% for the high point.The Central Gaps scanner detects a bullish gap which is a sign that buyers have taken the lead in the very short term.
Opening Gap UP
Type : Bullish
Timeframe : Openning
So that you have an overall view of the price change, here is a table showing the variations over several periods:
Technical
Technical analysis of NYXOAH in Daily shows an overall bearish trend. 75.00% of the signals given by moving averages are bearish. Caution: the neutral signals currently given by short-term moving averages show us that the global trend is losing momentum. The Central Indicators market scanner is currently detecting several bullish signals that could impact this trend:
Bullish price crossover with Moving Average 20
Type : Bullish
Timeframe : Daily
Bullish price crossover with adaptative moving average 50
Type : Bullish
Timeframe : Daily
An assessment of technical indicators shows a moderate bullish signal.
But beware of excesses. The Central Indicators scanner currently detects this:
Williams %R indicator is overbought : over -20
Type : Neutral
Timeframe : Daily
Pivot points : price is over resistance 1
Type : Neutral
Timeframe : Weekly
Pivot points : price is over resistance 3
Type : Neutral
Timeframe : Daily
RSI indicator is back over 50
Type : Bullish
Timeframe : Daily
SuperTrend indicator bullish reversal
Type : Bullish
Timeframe : Daily
Momentum indicator is back over 0
Type : Bullish
Timeframe : Daily
The analysis of the price chart with Central Patterns scanners does not return any result.
No result was found by the Central Candlesticks scanner on Japanese candlesticks.
| S1 | Price | R1 | R2 | R3 | |
|---|---|---|---|---|---|
| ProTrendLines | 7.86 | 10.70 | 11.00 | 13.47 | 16.94 |
| Change (%) | -26.54% | - | +2.80% | +25.89% | +58.32% |
| Change | -2.84 | - | +0.30 | +2.77 | +6.24 |
| Level | Intermediate | - | Minor | Minor | Major |
Attention could also be paid to pivot points to set price objectives:
| Pivot points | S3 | S2 | S1 | PP | R1 | R2 | R3 |
|---|---|---|---|---|---|---|---|
| Standard | 8.48 | 8.70 | 8.80 | 9.02 | 9.12 | 9.34 | 9.44 |
| Camarilla | 8.82 | 8.85 | 8.88 | 8.91 | 8.94 | 8.97 | 9.00 |
| Woodie | 8.43 | 8.67 | 8.75 | 8.99 | 9.07 | 9.31 | 9.39 |
| Fibonacci | 8.70 | 8.82 | 8.89 | 9.02 | 9.14 | 9.21 | 9.34 |
| Pivot points | S3 | S2 | S1 | PP | R1 | R2 | R3 |
|---|---|---|---|---|---|---|---|
| Standard | 5.70 | 7.06 | 7.89 | 9.25 | 10.08 | 11.44 | 12.27 |
| Camarilla | 8.13 | 8.33 | 8.53 | 8.73 | 8.93 | 9.13 | 9.33 |
| Woodie | 5.45 | 6.93 | 7.64 | 9.12 | 9.83 | 11.31 | 12.02 |
| Fibonacci | 7.06 | 7.89 | 8.41 | 9.25 | 10.08 | 10.60 | 11.44 |
| Pivot points | S3 | S2 | S1 | PP | R1 | R2 | R3 |
|---|---|---|---|---|---|---|---|
| Standard | 3.51 | 6.35 | 8.03 | 10.87 | 12.55 | 15.39 | 17.07 |
| Camarilla | 8.46 | 8.87 | 9.29 | 9.70 | 10.11 | 10.53 | 10.94 |
| Woodie | 2.92 | 6.06 | 7.44 | 10.58 | 11.96 | 15.10 | 16.48 |
| Fibonacci | 6.35 | 8.08 | 9.15 | 10.87 | 12.60 | 13.67 | 15.39 |
Numerical data
The following are the details of the technical indicators and moving averages that were collected to generate this technical analysis:
| RSI (14): | 57.61 | |
| MACD (12,26,9): | -0.6500 | |
| Directional Movement: | 12.76 | |
| AROON (14): | -50.00 | |
| DEMA (21): | 8.46 | |
| Parabolic SAR (0,02-0,02-0,2): | 7.86 | |
| Elder Ray (13): | 1.05 | |
| Super Trend (3,10): | 7.56 | |
| Zig ZAG (10): | 10.70 | |
| VORTEX (21): | 0.8200 | |
| Stochastique (14,3,5): | 56.94 | |
| TEMA (21): | 8.72 | |
| Williams %R (14): | 0.00 | |
| Chande Momentum Oscillator (20): | 1.66 | |
| Repulse (5,40,3): | 1.7600 | |
| ROCnROLL: | -1 | |
| TRIX (15,9): | -1.2700 | |
| Courbe Coppock: | 18.69 |
| MA7: | 9.00 | |
| MA20: | 9.21 | |
| MA50: | 11.23 | |
| MA100: | 14.05 | |
| MAexp7: | 9.21 | |
| MAexp20: | 9.47 | |
| MAexp50: | 11.14 | |
| MAexp100: | 13.33 | |
| Price / MA7: | +18.89% | |
| Price / MA20: | +16.18% | |
| Price / MA50: | -4.72% | |
| Price / MA100: | -23.84% | |
| Price / MAexp7: | +16.18% | |
| Price / MAexp20: | +12.99% | |
| Price / MAexp50: | -3.95% | |
| Price / MAexp100: | -19.73% |
News
The last news published on NYXOAH at the time of the generation of this analysis was as follows:
- Nyxoah Receives FDA IDE Approval to Initiate the ACCCESS Study of Genio® in Complete Concentric Collapse Patients
- Information on the total number of voting rights and shares
- Nyxoah Joins the Euronext Tech Leaders Initiative, Included in the Euronext Tech Leaders Index
- FDA Approves Genio® 2.1 For Use in DREAM U.S. IDE Pivotal Study
- Nyxoah Reports First Quarter 2022 Financial and Operating Results
About author
Online


Add a comment
Comments
0 comments on the analysis NYXOAH - Daily