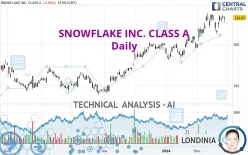
SNOWFLAKE INC. CLASS A - Daily - Technical analysis published on 02/28/2024 (GMT)
- 243
- 0
Click here for a new analysis!
- Timeframe : Daily
- - Analysis generated on
- Status : INVALID
Summary of the analysis

Additional analysis
Quotes
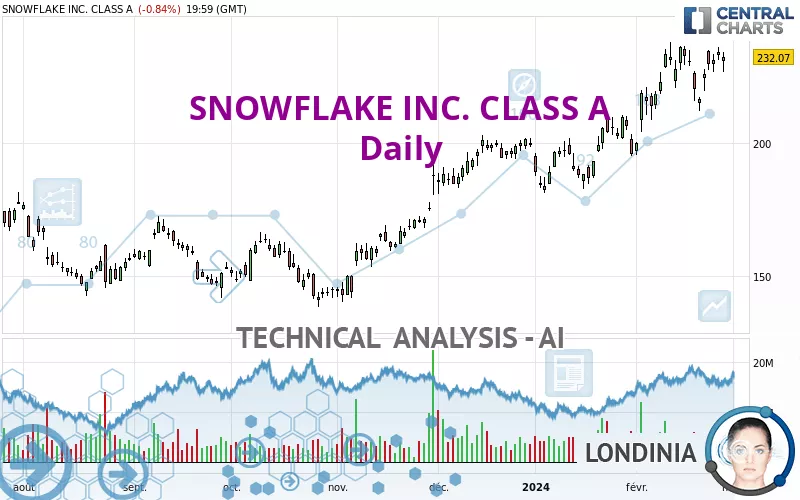
The SNOWFLAKE INC. CLASS A rating is 231.98 USD. The price registered a decrease of -0.88% on the session and was between 226.56 USD and 233.88 USD. This implies that the price is at +2.39% from its lowest and at -0.81% from its highest.The Central Gaps scanner detects the formation of a bearish gap marking the strong presence of sellers ahead of buyers at the opening. This formed a quotation gap.
Opening Gap DOWN
Type : Bearish
Timeframe : Openning
So that you have an overall view of the price change, here is a table showing the variations over several periods:
Near a new HIGH record (1 year)
Type : Bullish
Timeframe : Weekly
Near a new HIGH record (1st january)
Type : Bullish
Timeframe : Weekly
Near a new HIGH record (1 month)
Type : Bullish
Timeframe : Weekly
Technical
A technical analysis in Daily of this SNOWFLAKE INC. CLASS A chart shows a strongly bullish trend. The signals given by the moving averages are 92.86% bullish. This strong bullish trend is confirmed by the strong signals currently being given by short-term moving averages. The Central Indicators scanner does not detect any result on moving averages that would impact this trend.
An assessment of technical indicators shows a slightly bullish signal.
Caution: the Central Indicators scanner currently detects an excess:
MACD indicator: bearish divergence
Type : Bearish
Timeframe : Daily
Aroon indicator bearish trend
Type : Bearish
Timeframe : Daily
Momentum indicator is back under 0
Type : Bearish
Timeframe : Daily
Central Patterns, the market scanner focusing on chart patterns, resistances and supports found this result:
Near horizontal resistance
Type : Bearish
Timeframe : Daily
The Central Candlesticks scanner which studies Japanese candlesticks did not detect anything.
| S3 | S2 | S1 | Price | R1 | R2 | R3 | |
|---|---|---|---|---|---|---|---|
| ProTrendLines | 140.84 | 169.91 | 189.53 | 231.98 | 236.57 | 267.85 | 312.67 |
| Change (%) | -39.29% | -26.76% | -18.30% | - | +1.98% | +15.46% | +34.78% |
| Change | -91.14 | -62.07 | -42.45 | - | +4.59 | +35.87 | +80.69 |
| Level | Intermediate | Intermediate | Major | - | Major | Minor | Minor |
Attention could also be paid to pivot points to set price objectives:
| Pivot points | S3 | S2 | S1 | PP | R1 | R2 | R3 |
|---|---|---|---|---|---|---|---|
| Standard | 226.96 | 229.02 | 231.53 | 233.59 | 236.10 | 238.16 | 240.67 |
| Camarilla | 232.77 | 233.19 | 233.61 | 234.03 | 234.45 | 234.87 | 235.29 |
| Woodie | 227.18 | 229.13 | 231.75 | 233.70 | 236.32 | 238.27 | 240.89 |
| Fibonacci | 229.02 | 230.77 | 231.85 | 233.59 | 235.34 | 236.42 | 238.16 |
| Pivot points | S3 | S2 | S1 | PP | R1 | R2 | R3 |
|---|---|---|---|---|---|---|---|
| Standard | 192.59 | 202.13 | 215.74 | 225.28 | 238.89 | 248.43 | 262.04 |
| Camarilla | 222.97 | 225.10 | 227.22 | 229.34 | 231.46 | 233.58 | 235.71 |
| Woodie | 194.62 | 203.15 | 217.77 | 226.30 | 240.92 | 249.45 | 264.07 |
| Fibonacci | 202.13 | 210.98 | 216.44 | 225.28 | 234.13 | 239.59 | 248.43 |
| Pivot points | S3 | S2 | S1 | PP | R1 | R2 | R3 |
|---|---|---|---|---|---|---|---|
| Standard | 149.81 | 165.38 | 180.51 | 196.08 | 211.21 | 226.78 | 241.91 |
| Camarilla | 187.20 | 190.01 | 192.83 | 195.64 | 198.45 | 201.27 | 204.08 |
| Woodie | 149.59 | 165.27 | 180.29 | 195.97 | 210.99 | 226.67 | 241.69 |
| Fibonacci | 165.38 | 177.11 | 184.35 | 196.08 | 207.81 | 215.05 | 226.78 |
Numerical data
The following is the status of the technical indicators and moving averages at the time of publication of this technical analysis:
| RSI (14): | 60.53 | |
| MACD (12,26,9): | 7.3900 | |
| Directional Movement: | 10.30 | |
| AROON (14): | -42.86 | |
| DEMA (21): | 232.91 | |
| Parabolic SAR (0,02-0,02-0,2): | 212.16 | |
| Elder Ray (13): | 3.60 | |
| Super Trend (3,10): | 207.51 | |
| Zig ZAG (10): | 231.02 | |
| VORTEX (21): | 1.0400 | |
| Stochastique (14,3,5): | 79.08 | |
| TEMA (21): | 233.63 | |
| Williams %R (14): | -26.11 | |
| Chande Momentum Oscillator (20): | -0.81 | |
| Repulse (5,40,3): | 2.3700 | |
| ROCnROLL: | 1 | |
| TRIX (15,9): | 0.5500 | |
| Courbe Coppock: | 12.09 |
| MA7: | 226.78 | |
| MA20: | 223.19 | |
| MA50: | 207.17 | |
| MA100: | 185.76 | |
| MAexp7: | 229.51 | |
| MAexp20: | 222.76 | |
| MAexp50: | 208.78 | |
| MAexp100: | 193.89 | |
| Price / MA7: | +2.29% | |
| Price / MA20: | +3.94% | |
| Price / MA50: | +11.98% | |
| Price / MA100: | +24.88% | |
| Price / MAexp7: | +1.12% | |
| Price / MAexp20: | +4.18% | |
| Price / MAexp50: | +11.16% | |
| Price / MAexp100: | +19.69% |
About author

Online


Add a comment
Comments
0 comments on the analysis SNOWFLAKE INC. CLASS A - Daily