DIGITALX LIMITED - Daily - Technical analysis published on 11/06/2021 (GMT)
- 205
- 0
Click here for a new analysis!
- Timeframe : Daily
- - Analysis generated on
- Status : TARGET REACHED

Summary of the analysis

Additional analysis
Quotes
DIGITALX LIMITED rating 0.100 AUD. On the day, this instrument lost -4.76% and was between 0.098 AUD and 0.102 AUD. This implies that the price is at +2.04% from its lowest and at -1.96% from its highest.Here is a more detailed summary of the historical variations registered by DIGITALX LIMITED:
Near a new HIGH record (1st january)
Type : Bullish
Timeframe : Weekly
Near a new HIGH record (1 month)
Type : Bullish
Timeframe : Weekly
Technical
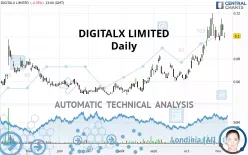
Technical analysis of this Daily chart of DIGITALX LIMITED indicates that the overall trend is strongly bullish. The signals given by the moving averages are 92.86% bullish. This strong bullish trend is confirmed by the strong signals currently being given by short-term moving averages. The Central Indicators scanner detects a bullish signal on moving averages that could impact this trend:
Bullish price crossover with adaptative moving average 20
Type : Bullish
Timeframe : Daily
In fact, according to the parameters integrated into the Central Analyzer system, 10 technical indicators out of 18 analysed are currently bullish. Central Indicators, the scanner specialised in technical indicators, has identified these signals:
Pivot points : price is over resistance 3
Type : Neutral
Timeframe : Daily
Price is back under the pivot point
Type : Bearish
Timeframe : Daily
Williams %R indicator is back over -50
Type : Bullish
Timeframe : Daily
An analysis of the price chart with the Central Patterns scanner (detector of chart patterns and resistances and supports) shows a result that can have an impact on the price change:
Near horizontal support
Type : Bullish
Timeframe : Daily
The Central Candlesticks scanner, specialised in Japanese candlesticks, did not identify any signals.
| S3 | S2 | S1 | Price | R1 | R2 | R3 | |
|---|---|---|---|---|---|---|---|
| ProTrendLines | 0.061 | 0.079 | 0.091 | 0.100 | 0.105 | 0.115 | 0.120 |
| Change (%) | -39.00% | -21.00% | -9.00% | - | +5.00% | +15.00% | +20.00% |
| Change | -0.039 | -0.021 | -0.009 | - | +0.005 | +0.015 | +0.020 |
| Level | Minor | Major | Intermediate | - | Minor | Major | Intermediate |
Attention could also be paid to pivot points to set price objectives:
| Pivot points | S3 | S2 | S1 | PP | R1 | R2 | R3 |
|---|---|---|---|---|---|---|---|
| Standard | 0.094 | 0.096 | 0.098 | 0.100 | 0.102 | 0.104 | 0.106 |
| Camarilla | 0.099 | 0.099 | 0.100 | 0.100 | 0.100 | 0.101 | 0.101 |
| Woodie | 0.094 | 0.096 | 0.098 | 0.100 | 0.102 | 0.104 | 0.106 |
| Fibonacci | 0.096 | 0.098 | 0.099 | 0.100 | 0.102 | 0.103 | 0.104 |
| Pivot points | S3 | S2 | S1 | PP | R1 | R2 | R3 |
|---|---|---|---|---|---|---|---|
| Standard | 0.073 | 0.085 | 0.092 | 0.104 | 0.111 | 0.123 | 0.130 |
| Camarilla | 0.095 | 0.097 | 0.098 | 0.100 | 0.102 | 0.104 | 0.105 |
| Woodie | 0.072 | 0.084 | 0.091 | 0.103 | 0.110 | 0.122 | 0.129 |
| Fibonacci | 0.085 | 0.092 | 0.096 | 0.104 | 0.111 | 0.115 | 0.123 |
| Pivot points | S3 | S2 | S1 | PP | R1 | R2 | R3 |
|---|---|---|---|---|---|---|---|
| Standard | 0.012 | 0.037 | 0.069 | 0.094 | 0.126 | 0.151 | 0.183 |
| Camarilla | 0.084 | 0.090 | 0.095 | 0.100 | 0.105 | 0.111 | 0.116 |
| Woodie | 0.015 | 0.039 | 0.072 | 0.096 | 0.129 | 0.153 | 0.186 |
| Fibonacci | 0.037 | 0.059 | 0.073 | 0.094 | 0.116 | 0.130 | 0.151 |
Numerical data
The following is the status of technical indicators and moving averages registered at the time this technical analysis was created:
| RSI (14): | 60.08 | |
| MACD (12,26,9): | 0.0080 | |
| Directional Movement: | 20.309 | |
| AROON (14): | 50.000 | |
| DEMA (21): | 0.107 | |
| Parabolic SAR (0,02-0,02-0,2): | 0.119 | |
| Elder Ray (13): | 0.005 | |
| Super Trend (3,10): | 0.092 | |
| Zig ZAG (10): | 0.105 | |
| VORTEX (21): | 1.0430 | |
| Stochastique (14,3,5): | 59.95 | |
| TEMA (21): | 0.109 | |
| Williams %R (14): | -40.54 | |
| Chande Momentum Oscillator (20): | 0.015 | |
| Repulse (5,40,3): | -0.5190 | |
| ROCnROLL: | 1 | |
| TRIX (15,9): | 1.6290 | |
| Courbe Coppock: | 53.60 |
| MA7: | 0.103 | |
| MA20: | 0.095 | |
| MA50: | 0.079 | |
| MA100: | 0.066 | |
| MAexp7: | 0.103 | |
| MAexp20: | 0.096 | |
| MAexp50: | 0.083 | |
| MAexp100: | 0.074 | |
| Price / MA7: | -2.91% | |
| Price / MA20: | +5.26% | |
| Price / MA50: | +26.58% | |
| Price / MA100: | +51.52% | |
| Price / MAexp7: | -2.91% | |
| Price / MAexp20: | +4.17% | |
| Price / MAexp50: | +20.48% | |
| Price / MAexp100: | +35.14% |
News
The last news published on DIGITALX LIMITED at the time of the generation of this analysis was as follows:
About author

Online


Add a comment
Comments
0 comments on the analysis DIGITALX LIMITED - Daily