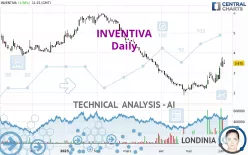
INVENTIVA - Daily - Technical analysis published on 06/05/2023 (GMT)
- 138
- 0
Click here for a new analysis!
- Timeframe : Daily
- - Analysis generated on
- Status : TARGET REACHED

Summary of the analysis

Additional analysis
Quotes
The INVENTIVA rating is 3.475 EUR. On the day, this instrument gained +4.99% with the lowest point at 3.450 EUR and the highest point at 3.660 EUR. The deviation from the price is +0.72% for the low point and -5.05% for the high point.The Central Gaps scanner detects a bullish opening marking the presence of buyers ahead of sellers at the opening but not sufficiently marked to allow the price to register a quotation gap.
Bullish opening
Type : Bullish
Timeframe : Openning
Here is a more detailed summary of the historical variations registered by INVENTIVA:
Near a new HIGH record (1 month)
Type : Bullish
Timeframe : Weekly
The Central Volumes scanner notes the presence of abnormal volumes:
Abnormal volumes
Timeframe : 5 days
Abnormal volumes
Timeframe : 20 days
Abnormal volumes
Timeframe : 50 days
Technical
A technical analysis in Daily of this INVENTIVA chart shows a slightly bearish trend. 57.14% of the signals given by moving averages are bearish. Caution: the strong bullish signals currently being given by short-term moving averages indicate that this slightly bearish trend could quickly be reversed. There is no crossing of moving average by the price or crossing of moving averages between themselves.
Technical indicators are strongly bullish, suggesting that the price increase should continue.
Caution: the Central Indicators scanner currently detects an excess:
CCI indicator is overbought : over 100
Type : Neutral
Timeframe : Daily
Williams %R indicator is overbought : over -20
Type : Neutral
Timeframe : Daily
Price is back over the pivot point
Type : Bullish
Timeframe : Daily
Central Patterns, the market scanner focusing on chart patterns, resistances and supports found these results:
Near resistance of triangle
Type : Bearish
Timeframe : Daily
Resistance of channel is broken
Type : Bullish
Timeframe : Daily
The presence of a bullish Japanese candlestick pattern detected by Central Candlesticks that could cause a very short term rebound was also detected:
Bullish harami
Type : Bullish
Timeframe : Daily
| S2 | S1 | Price | R1 | R2 | R3 | |
|---|---|---|---|---|---|---|
| ProTrendLines | 2.133 | 2.870 | 3.475 | 3.915 | 4.662 | 5.940 |
| Change (%) | -38.62% | -17.41% | - | +12.66% | +34.16% | +70.94% |
| Change | -1.342 | -0.605 | - | +0.440 | +1.187 | +2.465 |
| Level | Major | Minor | - | Intermediate | Minor | Intermediate |
Attention could also be paid to pivot points to set price objectives:
| Pivot points | S3 | S2 | S1 | PP | R1 | R2 | R3 |
|---|---|---|---|---|---|---|---|
| Standard | 2.590 | 2.930 | 3.120 | 3.460 | 3.650 | 3.990 | 4.180 |
| Camarilla | 3.164 | 3.213 | 3.261 | 3.310 | 3.359 | 3.407 | 3.456 |
| Woodie | 2.515 | 2.893 | 3.045 | 3.423 | 3.575 | 3.953 | 4.105 |
| Fibonacci | 2.930 | 3.133 | 3.258 | 3.460 | 3.663 | 3.788 | 3.990 |
| Pivot points | S3 | S2 | S1 | PP | R1 | R2 | R3 |
|---|---|---|---|---|---|---|---|
| Standard | 1.382 | 1.963 | 2.637 | 3.218 | 3.892 | 4.473 | 5.147 |
| Camarilla | 2.965 | 3.080 | 3.195 | 3.310 | 3.425 | 3.540 | 3.655 |
| Woodie | 1.428 | 1.986 | 2.683 | 3.241 | 3.938 | 4.496 | 5.193 |
| Fibonacci | 1.963 | 2.443 | 2.739 | 3.218 | 3.698 | 3.994 | 4.473 |
| Pivot points | S3 | S2 | S1 | PP | R1 | R2 | R3 |
|---|---|---|---|---|---|---|---|
| Standard | 1.245 | 1.685 | 2.460 | 2.900 | 3.675 | 4.115 | 4.890 |
| Camarilla | 2.901 | 3.012 | 3.124 | 3.235 | 3.346 | 3.458 | 3.569 |
| Woodie | 1.413 | 1.769 | 2.628 | 2.984 | 3.843 | 4.199 | 5.058 |
| Fibonacci | 1.685 | 2.149 | 2.436 | 2.900 | 3.364 | 3.651 | 4.115 |
Numerical data
The following are the details of the technical indicators and moving averages that were collected to generate this technical analysis:
| RSI (14): | 65.04 | |
| MACD (12,26,9): | 0.1800 | |
| Directional Movement: | 22.014 | |
| AROON (14): | 85.714 | |
| DEMA (21): | 3.009 | |
| Parabolic SAR (0,02-0,02-0,2): | 2.639 | |
| Elder Ray (13): | 0.588 | |
| Super Trend (3,10): | 2.565 | |
| Zig ZAG (10): | 3.475 | |
| VORTEX (21): | 1.1330 | |
| Stochastique (14,3,5): | 78.67 | |
| TEMA (21): | 3.336 | |
| Williams %R (14): | -20.00 | |
| Chande Momentum Oscillator (20): | 1.080 | |
| Repulse (5,40,3): | -7.0050 | |
| ROCnROLL: | 1 | |
| TRIX (15,9): | 0.3430 | |
| Courbe Coppock: | 63.38 |
| MA7: | 3.086 | |
| MA20: | 2.698 | |
| MA50: | 2.702 | |
| MA100: | 3.910 | |
| MAexp7: | 3.169 | |
| MAexp20: | 2.846 | |
| MAexp50: | 2.974 | |
| MAexp100: | 3.488 | |
| Price / MA7: | +12.61% | |
| Price / MA20: | +28.80% | |
| Price / MA50: | +28.61% | |
| Price / MA100: | -11.13% | |
| Price / MAexp7: | +9.66% | |
| Price / MAexp20: | +22.10% | |
| Price / MAexp50: | +16.85% | |
| Price / MAexp100: | -0.37% |
News
The latest news and videos published on INVENTIVA at the time of the analysis were as follows:
- Results of the votes of the Combined Shareholders’ General Meeting of May 25, 2023
- Statement of total voting rights and shares forming the company’s share capital as of April 17, 2023
- Inventiva announces filing of its 2022 Universal Registration Document and 2022 Annual Report on Form 20-F
- Inventiva reports its 2022 full-year results
- Inventiva reports preliminary financial results for Full-Year 2022¹
About author
Online


Add a comment
Comments
0 comments on the analysis INVENTIVA - Daily