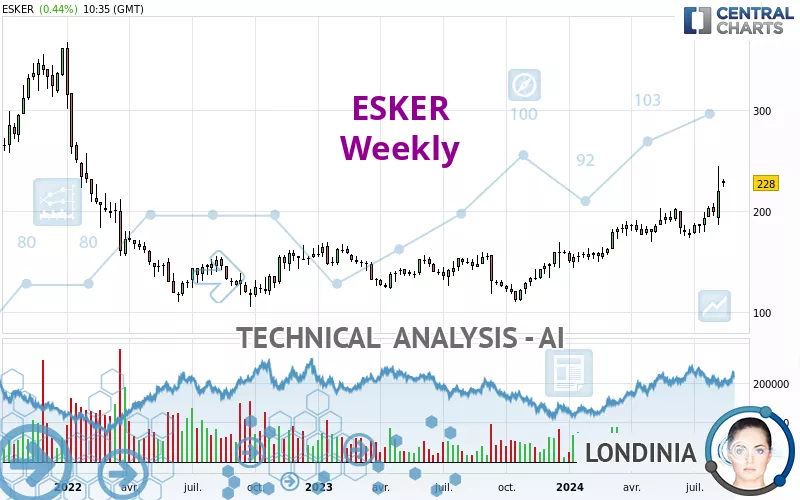
ESKER - Weekly - Technical analysis published on 08/13/2024 (GMT)
- 158
- 0
Click here for a new analysis!
- Timeframe : Weekly
- - Analysis generated on
- Status : TARGET REACHED

Summary of the analysis
Additional analysis
Quotes
The ESKER price is 228.0 EUR. The price is up +16.09% over 5 days and has been traded over the last 5 days between 200.6 EUR and 244.2 EUR. This implies that the 5 day price is +13.66% from its lowest point and -6.63% from its highest point.A bullish opening was detected by the Central Gaps scanner. Buyers are trying to impose a bullish momentum in the very short term.
Bullish opening
Type : Bullish
Timeframe : Openning
Here is a more detailed summary of the historical variations registered by ESKER:
Abnormal volumes
Timeframe : 5 days
Technical
A technical analysis in Weekly of this ESKER chart shows a strongly bullish trend. 92.86% of the signals given by moving averages are bullish. This strongly bullish trend is supported by the strong bullish signals given by short-term moving averages. An assessment of moving averages reveals a bullish signal that could impact this trend:
Moving Average bullish crossovers : AMA50 & AMA100
Type : Bullish
Timeframe : Weekly
The probability of a further increase is high given the direction of the technical indicators.
Caution: the Central Indicators scanner currently detects an excess:
RSI indicator is overbought : over 70
Type : Neutral
Timeframe : Weekly
CCI indicator is overbought : over 100
Type : Neutral
Timeframe : Weekly
Previous candle closed over Bollinger bands
Type : Neutral
Timeframe : Weekly
An analysis of the price chart with the Central Patterns scanner (detector of chart patterns and resistances and supports) shows a result that can have an impact on the price change:
Resistance of channel is broken
Type : Bullish
Timeframe : Weekly
No result was found by the Central Candlesticks scanner on Japanese candlesticks.
| S3 | S2 | S1 | Price | R1 | R2 | R3 | |
|---|---|---|---|---|---|---|---|
| ProTrendLines | 111.3 | 158.5 | 201.1 | 228.0 | 236.4 | 279.8 | 299.6 |
| Change (%) | -51.18% | -30.48% | -11.80% | - | +3.68% | +22.72% | +31.40% |
| Change | -116.7 | -69.5 | -26.9 | - | +8.4 | +51.8 | +71.6 |
| Level | Major | Major | Intermediate | - | Intermediate | Minor | Minor |
Attention could also be paid to pivot points to set price objectives:
| Pivot points | S3 | S2 | S1 | PP | R1 | R2 | R3 |
|---|---|---|---|---|---|---|---|
| Standard | 214.7 | 219.1 | 223.1 | 227.5 | 231.5 | 235.9 | 239.9 |
| Camarilla | 224.7 | 225.5 | 226.2 | 227.0 | 227.8 | 228.5 | 229.3 |
| Woodie | 214.4 | 219.0 | 222.8 | 227.4 | 231.2 | 235.8 | 239.6 |
| Fibonacci | 219.1 | 222.3 | 224.3 | 227.5 | 230.7 | 232.7 | 235.9 |
| Pivot points | S3 | S2 | S1 | PP | R1 | R2 | R3 |
|---|---|---|---|---|---|---|---|
| Standard | 130.7 | 158.3 | 189.1 | 216.7 | 247.5 | 275.1 | 305.9 |
| Camarilla | 203.9 | 209.3 | 214.7 | 220.0 | 225.4 | 230.7 | 236.1 |
| Woodie | 132.4 | 159.1 | 190.8 | 217.5 | 249.2 | 275.9 | 307.6 |
| Fibonacci | 158.3 | 180.6 | 194.4 | 216.7 | 239.0 | 252.8 | 275.1 |
| Pivot points | S3 | S2 | S1 | PP | R1 | R2 | R3 |
|---|---|---|---|---|---|---|---|
| Standard | 156.0 | 166.5 | 184.7 | 195.2 | 213.4 | 223.9 | 242.1 |
| Camarilla | 195.1 | 197.7 | 200.4 | 203.0 | 205.6 | 208.3 | 210.9 |
| Woodie | 160.0 | 168.4 | 188.7 | 197.1 | 217.4 | 225.8 | 246.1 |
| Fibonacci | 166.5 | 177.4 | 184.2 | 195.2 | 206.1 | 212.9 | 223.9 |
Numerical data
The following are the details of the technical indicators and moving averages that were collected to generate this technical analysis:
| RSI (14): | 73.50 | |
| MACD (12,26,9): | 12.3000 | |
| Directional Movement: | 27.0 | |
| AROON (14): | 42.9 | |
| DEMA (21): | 207.2 | |
| Parabolic SAR (0,02-0,02-0,2): | 183.1 | |
| Elder Ray (13): | 29.6 | |
| Super Trend (3,10): | 177.7 | |
| Zig ZAG (10): | 228.0 | |
| VORTEX (21): | 1.1000 | |
| Stochastique (14,3,5): | 73.40 | |
| TEMA (21): | 211.4 | |
| Williams %R (14): | -22.90 | |
| Chande Momentum Oscillator (20): | 34.6 | |
| Repulse (5,40,3): | 8.7000 | |
| ROCnROLL: | 1 | |
| TRIX (15,9): | 0.8000 | |
| Courbe Coppock: | 21.10 |
| MA7: | 209.8 | |
| MA20: | 202.7 | |
| MA50: | 192.1 | |
| MA100: | 188.9 | |
| MAexp7: | 206.7 | |
| MAexp20: | 191.7 | |
| MAexp50: | 174.6 | |
| MAexp100: | 166.4 | |
| Price / MA7: | +8.67% | |
| Price / MA20: | +12.48% | |
| Price / MA50: | +18.69% | |
| Price / MA100: | +20.70% | |
| Price / MAexp7: | +10.30% | |
| Price / MAexp20: | +18.94% | |
| Price / MAexp50: | +30.58% | |
| Price / MAexp100: | +37.02% |
News
Don't forget to follow the news on ESKER. At the time of publication of this analysis, the latest news was as follows:
- Esker Named Best Finance Automation Partner at FutureCFO Excellence Awards 2024
- Esker Named a Leader in the 2023 Gartner® Magic Quadrant™ for Integrated Invoice-to-Cash Applications
- Esker Asia Automates Key Business Processes for Brother International Singapore Pte Ltd
- Esker (ALESK): Record order intake in Q3
- Esker Partners HitPay to Offer Businesses More Payment Options
About author

Online


Add a comment
Comments
0 comments on the analysis ESKER - Weekly