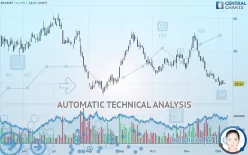
ERAMET - Daily - Technical analysis published on 12/06/2019 (GMT)
- 352
- 0
- Who voted?
Click here for a new analysis!
- Timeframe : Daily
- - Analysis generated on
- Status : INVALID

Summary of the analysis

Additional analysis
Quotes
The ERAMET price is 39.92 EUR. The price registered an increase of +0.20% on the session and was traded between 39.82 EUR and 40.19 EUR over the period. The price is currently at +0.25% from its lowest and -0.67% from its highest.The Central Gaps scanner detects a bullish opening. A small advantage for buyers in the very short term.
Bullish opening
Type : Bullish
Timeframe : Openning
Here is a more detailed summary of the historical variations registered by ERAMET:
Near a new LOW record (1 month)
Type : Bearish
Timeframe : Weekly
Technical
Technical analysis of ERAMET in Daily shows a overall strongly bearish trend. 92.86% of the signals given by moving averages are bearish. This strongly bearish trend is supported by the strong bearish signals given by short-term moving averages. The Central Indicators market scanner currently does not detect any result that concerns moving averages.
Technical indicators are bearish. There is still some doubt about the decline in the price.
Caution: the Central Indicators scanner currently detects an excess:
Williams %R indicator is oversold : under -80
Type : Neutral
Timeframe : Daily
Price is back under the pivot point
Type : Bearish
Timeframe : Daily
Price is back under the pivot point
Type : Bearish
Timeframe : Weekly
An analysis of the price chart with the Central Patterns scanner (detector of chart patterns and resistances and supports) shows a result that can have an impact on the price change:
Support of channel is broken
Type : Bearish
Timeframe : Daily
The Central Candlesticks scanner which studies Japanese candlesticks did not detect anything.
| S2 | S1 | Price | R1 | R2 | R3 | |
|---|---|---|---|---|---|---|
| ProTrendLines | 15.80 | 36.81 | 39.92 | 44.74 | 54.44 | 59.62 |
| Change (%) | -60.42% | -7.79% | - | +12.07% | +36.37% | +49.35% |
| Change | -24.12 | -3.11 | - | +4.82 | +14.52 | +19.70 |
| Level | Major | Major | - | Minor | Major | Minor |
Pivot points can also be used to set your price objectives. Here is the price situation in relation to pivot points:
| Pivot points | S3 | S2 | S1 | PP | R1 | R2 | R3 |
|---|---|---|---|---|---|---|---|
| Standard | 38.30 | 39.07 | 39.45 | 40.22 | 40.60 | 41.37 | 41.75 |
| Camarilla | 39.52 | 39.63 | 39.74 | 39.84 | 39.95 | 40.05 | 40.16 |
| Woodie | 38.12 | 38.97 | 39.27 | 40.12 | 40.42 | 41.27 | 41.57 |
| Fibonacci | 39.07 | 39.51 | 39.78 | 40.22 | 40.66 | 40.93 | 41.37 |
| Pivot points | S3 | S2 | S1 | PP | R1 | R2 | R3 |
|---|---|---|---|---|---|---|---|
| Standard | 35.61 | 37.98 | 39.28 | 41.65 | 42.95 | 45.32 | 46.62 |
| Camarilla | 39.57 | 39.91 | 40.24 | 40.58 | 40.92 | 41.25 | 41.59 |
| Woodie | 35.08 | 37.71 | 38.75 | 41.38 | 42.42 | 45.05 | 46.09 |
| Fibonacci | 37.98 | 39.38 | 40.25 | 41.65 | 43.05 | 43.92 | 45.32 |
| Pivot points | S3 | S2 | S1 | PP | R1 | R2 | R3 |
|---|---|---|---|---|---|---|---|
| Standard | 20.22 | 30.29 | 35.43 | 45.50 | 50.64 | 60.71 | 65.85 |
| Camarilla | 36.40 | 37.79 | 39.19 | 40.58 | 41.97 | 43.37 | 44.76 |
| Woodie | 17.77 | 29.06 | 32.98 | 44.27 | 48.19 | 59.48 | 63.40 |
| Fibonacci | 30.29 | 36.10 | 39.69 | 45.50 | 51.31 | 54.90 | 60.71 |
Numerical data
The following are the details of the technical indicators and moving averages that were collected to generate this technical analysis:
| RSI (14): | 33.51 | |
| MACD (12,26,9): | -2.1200 | |
| Directional Movement: | -16.06 | |
| AROON (14): | -78.57 | |
| DEMA (21): | 40.30 | |
| Parabolic SAR (0,02-0,02-0,2): | 42.97 | |
| Elder Ray (13): | -1.67 | |
| Super Trend (3,10): | 44.47 | |
| Zig ZAG (10): | 39.84 | |
| VORTEX (21): | 0.6700 | |
| Stochastique (14,3,5): | 8.44 | |
| TEMA (21): | 38.86 | |
| Williams %R (14): | -92.71 | |
| Chande Momentum Oscillator (20): | -3.86 | |
| Repulse (5,40,3): | -5.2900 | |
| ROCnROLL: | 2 | |
| TRIX (15,9): | -0.5400 | |
| Courbe Coppock: | 29.39 |
| MA7: | 40.23 | |
| MA20: | 43.68 | |
| MA50: | 45.67 | |
| MA100: | 45.71 | |
| MAexp7: | 40.47 | |
| MAexp20: | 42.86 | |
| MAexp50: | 45.13 | |
| MAexp100: | 46.88 | |
| Price / MA7: | -0.77% | |
| Price / MA20: | -8.61% | |
| Price / MA50: | -12.59% | |
| Price / MA100: | -12.67% | |
| Price / MAexp7: | -1.36% | |
| Price / MAexp20: | -6.86% | |
| Price / MAexp50: | -11.54% | |
| Price / MAexp100: | -14.85% |
News
Don"t forget to follow the news on ERAMET. At the time of publication of this analysis, the latest news was as follows:
- Eramet: Purchase of own shares
- Eramet obtains exploration permits for mineral sands in Cameroon
- Eramet: Success of the tender offer to repurchase the bonds due November 2020 and of a new issue of bonds for an amount of 300 million euros
- Eramet: Purchase of own shares
- Eramet: Purchase of own shares
About author

Online


Add a comment
Comments
0 comments on the analysis ERAMET - Daily