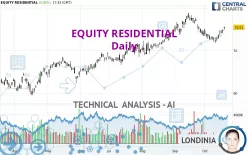
EQUITY RESIDENTIAL - Daily - Technical analysis published on 10/18/2024 (GMT)
- 104
- 0
Click here for a new analysis!
- Timeframe : Daily
- - Analysis generated on
- Status : INVALID

Summary of the analysis

Additional analysis
Quotes
The EQUITY RESIDENTIAL price is 75.51 USD. The price registered an increase of +0.86% on the session and was traded between 74.89 USD and 75.73 USD over the period. The price is currently at +0.83% from its lowest and -0.29% from its highest.A bullish gap was detected at the opening by the Central Gaps scanner. There are a lot of buyers and they have the upper hand in the very short term.
Opening Gap UP
Type : Bullish
Timeframe : Openning
A study of price movements over other periods shows the following variations:
Near a new HIGH record (1 year)
Type : Bullish
Timeframe : Weekly
Near a new HIGH record (1st january)
Type : Bullish
Timeframe : Weekly
Near a new LOW record (1 month)
Type : Bearish
Timeframe : Weekly
Technical
Technical analysis of this Daily chart of EQUITY RESIDENTIAL indicates that the overall trend is strongly bullish. 89.29% of the signals given by moving averages are bullish. The slightly bullish signals given by the short-term moving averages show a weakening of the global trend. The Central Indicators scanner does not detect any result on moving averages that would impact this trend.
In fact, 14 technical indicators on 18 studied are currently positioned bullish. Caution: the Central Indicators scanner currently detects an excess:
Williams %R indicator is overbought : over -20
Type : Neutral
Timeframe : Daily
Pivot points : price is over resistance 1
Type : Neutral
Timeframe : Daily
Pivot points : price is over resistance 3
Type : Neutral
Timeframe : Weekly
Aroon indicator bullish trend
Type : Bullish
Timeframe : Daily
MACD indicator is back over 0
Type : Bullish
Timeframe : Daily
No signals are given by Central Patterns, a market scanner specialised in chart patterns, resistances and supports.
The Central Candlesticks scanner which studies Japanese candlesticks did not detect anything.
| S3 | S2 | S1 | Price | R1 | R2 | |
|---|---|---|---|---|---|---|
| ProTrendLines | 70.75 | 72.46 | 75.08 | 75.51 | 77.39 | 86.00 |
| Change (%) | -6.30% | -4.04% | -0.57% | - | +2.49% | +13.89% |
| Change | -4.76 | -3.05 | -0.43 | - | +1.88 | +10.49 |
| Level | Minor | Intermediate | Major | - | Major | Major |
Pivot points can also be used to set your price objectives. Here is the price situation in relation to pivot points:
| Pivot points | S3 | S2 | S1 | PP | R1 | R2 | R3 |
|---|---|---|---|---|---|---|---|
| Standard | 73.29 | 73.64 | 74.25 | 74.60 | 75.21 | 75.56 | 76.17 |
| Camarilla | 74.61 | 74.69 | 74.78 | 74.87 | 74.96 | 75.05 | 75.13 |
| Woodie | 73.43 | 73.71 | 74.39 | 74.67 | 75.35 | 75.63 | 76.31 |
| Fibonacci | 73.64 | 74.00 | 74.23 | 74.60 | 74.96 | 75.19 | 75.56 |
| Pivot points | S3 | S2 | S1 | PP | R1 | R2 | R3 |
|---|---|---|---|---|---|---|---|
| Standard | 70.64 | 71.20 | 72.15 | 72.71 | 73.66 | 74.22 | 75.17 |
| Camarilla | 72.68 | 72.81 | 72.95 | 73.09 | 73.23 | 73.37 | 73.51 |
| Woodie | 70.83 | 71.30 | 72.34 | 72.81 | 73.85 | 74.32 | 75.36 |
| Fibonacci | 71.20 | 71.78 | 72.14 | 72.71 | 73.29 | 73.65 | 74.22 |
| Pivot points | S3 | S2 | S1 | PP | R1 | R2 | R3 |
|---|---|---|---|---|---|---|---|
| Standard | 67.30 | 70.21 | 72.33 | 75.24 | 77.36 | 80.27 | 82.39 |
| Camarilla | 73.08 | 73.54 | 74.00 | 74.46 | 74.92 | 75.38 | 75.84 |
| Woodie | 66.92 | 70.01 | 71.95 | 75.04 | 76.98 | 80.07 | 82.01 |
| Fibonacci | 70.21 | 72.13 | 73.32 | 75.24 | 77.16 | 78.35 | 80.27 |
Numerical data
The following is the status of technical indicators and moving averages registered at the time this technical analysis was created:
| RSI (14): | 61.48 | |
| MACD (12,26,9): | 0.0900 | |
| Directional Movement: | 10.76 | |
| AROON (14): | 42.86 | |
| DEMA (21): | 74.24 | |
| Parabolic SAR (0,02-0,02-0,2): | 72.22 | |
| Elder Ray (13): | 1.17 | |
| Super Trend (3,10): | 75.82 | |
| Zig ZAG (10): | 75.52 | |
| VORTEX (21): | 0.8900 | |
| Stochastique (14,3,5): | 92.02 | |
| TEMA (21): | 73.86 | |
| Williams %R (14): | -5.05 | |
| Chande Momentum Oscillator (20): | 1.64 | |
| Repulse (5,40,3): | 1.7500 | |
| ROCnROLL: | 1 | |
| TRIX (15,9): | -0.0200 | |
| Courbe Coppock: | 1.35 |
| MA7: | 73.99 | |
| MA20: | 74.05 | |
| MA50: | 73.82 | |
| MA100: | 70.53 | |
| MAexp7: | 74.38 | |
| MAexp20: | 74.13 | |
| MAexp50: | 73.26 | |
| MAexp100: | 70.83 | |
| Price / MA7: | +2.05% | |
| Price / MA20: | +1.97% | |
| Price / MA50: | +2.29% | |
| Price / MA100: | +7.06% | |
| Price / MAexp7: | +1.52% | |
| Price / MAexp20: | +1.86% | |
| Price / MAexp50: | +3.07% | |
| Price / MAexp100: | +6.61% |
News
Don't forget to follow the news on EQUITY RESIDENTIAL. At the time of publication of this analysis, the latest news was as follows:
- Equity Residential Reports Fourth Quarter 2023 Results
- Equity Residential Reports Second Quarter 2023 Results
- Equity Residential Announces Second Quarter 2023 Earnings Release Date
- Equity Residential Declares Second Quarter Dividends
- Equity Residential to Participate in Nareit Investor Conference
About author

Online


Add a comment
Comments
0 comments on the analysis EQUITY RESIDENTIAL - Daily