EOG RESOURCES INC. - 1H - Technical analysis published on 07/15/2024 (GMT)
- 154
- 0
Click here for a new analysis!
- Timeframe : 1H
- - Analysis generated on
- Status : LEVEL MAINTAINED
Summary of the analysis

Additional analysis
Quotes
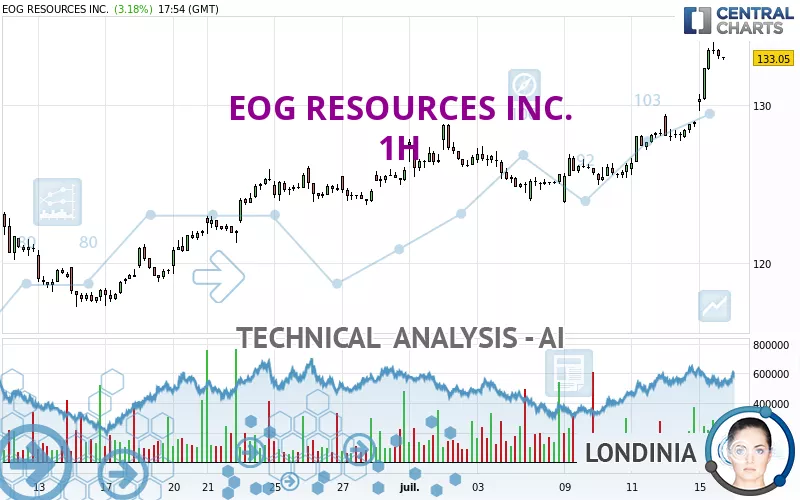
EOG RESOURCES INC. rating 133.09 USD. The price registered an increase of +3.21% on the session and was between 129.65 USD and 134.04 USD. This implies that the price is at +2.65% from its lowest and at -0.71% from its highest.A bullish gap was detected at the opening by the Central Gaps scanner. There are a lot of buyers and they have the upper hand in the very short term.
Opening Gap UP
Type : Bullish
Timeframe : Openning
Here is a more detailed summary of the historical variations registered by EOG RESOURCES INC.:
Near a new HIGH record (1 year)
Type : Bullish
Timeframe : Weekly
Near a new HIGH record (1st january)
Type : Bullish
Timeframe : Weekly
New HIGH record (1 month)
Type : Bullish
Timeframe : Weekly
Technical
Technical analysis of this 1H chart of EOG RESOURCES INC. indicates that the overall trend is strongly bullish. 92.86% of the signals given by moving averages are bullish. The overall trend is supported by the strong bullish signals from short-term moving averages. There is no crossing of moving average by the price or crossing of moving averages between themselves.
In fact, according to the parameters integrated into the Central Analyzer system, 15 technical indicators out of 18 analysed are currently bullish. Caution: the Central Indicators scanner currently detects an excess:
RSI indicator is overbought : over 80
Type : Neutral
Timeframe : 1 hour
CCI indicator is overbought : over 100
Type : Neutral
Timeframe : 1 hour
Previous candle closed over Bollinger bands
Type : Neutral
Timeframe : 1 hour
Williams %R indicator is overbought : over -20
Type : Neutral
Timeframe : 1 hour
Pivot points : price is over resistance 2
Type : Neutral
Timeframe : Weekly
Pivot points : price is over resistance 3
Type : Neutral
Timeframe : 1 hour
Central Patterns, the market scanner focusing on chart patterns, resistances and supports found this result:
Resistance of channel is broken
Type : Bullish
Timeframe : 1 hour
The Central Candlesticks scanner which studies Japanese candlesticks did not detect anything.
| S3 | S2 | S1 | Price | R1 | |
|---|---|---|---|---|---|
| ProTrendLines | 128.85 | 129.94 | 132.55 | 133.09 | 138.55 |
| Change (%) | -3.19% | -2.37% | -0.41% | - | +4.10% |
| Change | -4.24 | -3.15 | -0.54 | - | +5.46 |
| Level | Minor | Minor | Minor | - | Major |
Pivot points can also be used to set your price objectives. Here is the price situation in relation to pivot points:
| Pivot points | S3 | S2 | S1 | PP | R1 | R2 | R3 |
|---|---|---|---|---|---|---|---|
| Standard | 126.26 | 127.00 | 127.98 | 128.72 | 129.70 | 130.44 | 131.42 |
| Camarilla | 128.48 | 128.64 | 128.79 | 128.95 | 129.11 | 129.27 | 129.42 |
| Woodie | 126.37 | 127.06 | 128.09 | 128.78 | 129.81 | 130.50 | 131.53 |
| Fibonacci | 127.00 | 127.66 | 128.07 | 128.72 | 129.38 | 129.79 | 130.44 |
| Pivot points | S3 | S2 | S1 | PP | R1 | R2 | R3 |
|---|---|---|---|---|---|---|---|
| Standard | 119.71 | 121.76 | 125.36 | 127.41 | 131.01 | 133.06 | 136.66 |
| Camarilla | 127.40 | 127.91 | 128.43 | 128.95 | 129.47 | 129.99 | 130.50 |
| Woodie | 120.48 | 122.15 | 126.13 | 127.80 | 131.78 | 133.45 | 137.43 |
| Fibonacci | 121.76 | 123.92 | 125.26 | 127.41 | 129.57 | 130.91 | 133.06 |
| Pivot points | S3 | S2 | S1 | PP | R1 | R2 | R3 |
|---|---|---|---|---|---|---|---|
| Standard | 111.00 | 114.08 | 119.98 | 123.06 | 128.96 | 132.04 | 137.94 |
| Camarilla | 123.40 | 124.22 | 125.05 | 125.87 | 126.69 | 127.52 | 128.34 |
| Woodie | 112.40 | 114.79 | 121.38 | 123.77 | 130.36 | 132.75 | 139.34 |
| Fibonacci | 114.08 | 117.51 | 119.63 | 123.06 | 126.49 | 128.61 | 132.04 |
Numerical data
The following are the details of the technical indicators and moving averages that were collected to generate this technical analysis:
| RSI (14): | 81.20 | |
| MACD (12,26,9): | 1.6900 | |
| Directional Movement: | 44.77 | |
| AROON (14): | 92.86 | |
| DEMA (21): | 131.60 | |
| Parabolic SAR (0,02-0,02-0,2): | 130.91 | |
| Elder Ray (13): | 2.76 | |
| Super Trend (3,10): | 130.88 | |
| Zig ZAG (10): | 133.03 | |
| VORTEX (21): | 1.3900 | |
| Stochastique (14,3,5): | 91.63 | |
| TEMA (21): | 132.69 | |
| Williams %R (14): | -16.22 | |
| Chande Momentum Oscillator (20): | 4.83 | |
| Repulse (5,40,3): | 0.7000 | |
| ROCnROLL: | 1 | |
| TRIX (15,9): | 0.1300 | |
| Courbe Coppock: | 6.50 |
| MA7: | 127.51 | |
| MA20: | 124.97 | |
| MA50: | 125.39 | |
| MA100: | 125.67 | |
| MAexp7: | 131.83 | |
| MAexp20: | 129.63 | |
| MAexp50: | 127.73 | |
| MAexp100: | 126.25 | |
| Price / MA7: | +4.38% | |
| Price / MA20: | +6.50% | |
| Price / MA50: | +6.14% | |
| Price / MA100: | +5.90% | |
| Price / MAexp7: | +0.96% | |
| Price / MAexp20: | +2.67% | |
| Price / MAexp50: | +4.20% | |
| Price / MAexp100: | +5.42% |
News
The last news published on EOG RESOURCES INC. at the time of the generation of this analysis was as follows:
- EOG Resources Schedules Conference Call and Webcast of Second Quarter 2024 Results for August 2, 2024
- EOG Resources to Present at Upcoming Conference
- EOG Resources to Present at Upcoming Conference
- EOG Resources Reports First Quarter 2024 Results
- EOG Resources Announces President Billy Helms' Retirement
About author
Online


Add a comment
Comments
0 comments on the analysis EOG RESOURCES INC. - 1H