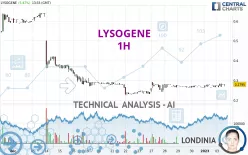
LYSOGENE - 1H - Technical analysis published on 01/03/2023 (GMT)
- 179
- 0
Click here for a new analysis!
- Timeframe : 1H
- - Analysis generated on
- Status : LEVEL MAINTAINED

Summary of the analysis
Additional analysis
Quotes
LYSOGENE rating 0.2795 EUR. On the day, this instrument gained +5.47% with the lowest point at 0.2665 EUR and the highest point at 0.2845 EUR. The deviation from the price is +4.88% for the low point and -1.76% for the high point.A bullish opening was detected by the Central Gaps scanner. Buyers are trying to impose a bullish momentum in the very short term.
Bullish opening
Type : Bullish
Timeframe : Openning
So that you have an overall view of the price change, here is a table showing the variations over several periods:
Near a new LOW record (1st january)
Type : Bearish
Timeframe : Weekly
Technical
Technical analysis of this 1H chart of LYSOGENE indicates that the overall trend is slightly bullish. 57.14% of the signals given by moving averages are bullish. This slightly bullish trend could be reinforced by the strong bullish signals given by short-term moving averages. The Central Indicators market scanner is currently detecting a bullish signal that could impact this trend:
Moving Average bullish crossovers : MA50 & MA100
Type : Bullish
Timeframe : 1 hour
In fact, 12 technical indicators on 18 studied are currently positioned bullish. Caution: the Central Indicators scanner currently detects an excess:
CCI indicator: bearish divergence
Type : Bearish
Timeframe : 1 hour
Pivot points : price is over resistance 1
Type : Neutral
Timeframe : 1 hour
Price is back over the pivot point
Type : Bullish
Timeframe : Weekly
An analysis of the price chart with the Central Patterns scanner (detector of chart patterns and resistances and supports) shows a result that can have an impact on the price change:
Near support of channel
Type : Bullish
Timeframe : 1 hour
The Central Candlesticks scanner currently notes the presence of this pattern in Japanese candlesticks that could mark the end of the short-term trend currently underway:
Doji
Type : Neutral
Timeframe : 1 hour
| S1 | Price | R1 | R2 | R3 | |
|---|---|---|---|---|---|
| ProTrendLines | 0.2320 | 0.2795 | 0.2900 | 0.3608 | 0.4735 |
| Change (%) | -16.99% | - | +3.76% | +29.09% | +69.41% |
| Change | -0.0475 | - | +0.0105 | +0.0813 | +0.1940 |
| Level | Major | - | Minor | Minor | Intermediate |
Attention could also be paid to pivot points to set price objectives:
| Pivot points | S3 | S2 | S1 | PP | R1 | R2 | R3 |
|---|---|---|---|---|---|---|---|
| Standard | 0.2447 | 0.2543 | 0.2597 | 0.2693 | 0.2747 | 0.2843 | 0.2897 |
| Camarilla | 0.2609 | 0.2623 | 0.2636 | 0.2650 | 0.2664 | 0.2678 | 0.2691 |
| Woodie | 0.2425 | 0.2533 | 0.2575 | 0.2683 | 0.2725 | 0.2833 | 0.2875 |
| Fibonacci | 0.2543 | 0.2601 | 0.2636 | 0.2693 | 0.2751 | 0.2786 | 0.2843 |
| Pivot points | S3 | S2 | S1 | PP | R1 | R2 | R3 |
|---|---|---|---|---|---|---|---|
| Standard | 0.1893 | 0.2147 | 0.2393 | 0.2647 | 0.2893 | 0.3147 | 0.3393 |
| Camarilla | 0.2503 | 0.2548 | 0.2594 | 0.2640 | 0.2686 | 0.2732 | 0.2778 |
| Woodie | 0.1890 | 0.2145 | 0.2390 | 0.2645 | 0.2890 | 0.3145 | 0.3390 |
| Fibonacci | 0.2147 | 0.2338 | 0.2456 | 0.2647 | 0.2838 | 0.2956 | 0.3147 |
| Pivot points | S3 | S2 | S1 | PP | R1 | R2 | R3 |
|---|---|---|---|---|---|---|---|
| Standard | -0.3023 | -0.0387 | 0.1127 | 0.3763 | 0.5277 | 0.7913 | 0.9427 |
| Camarilla | 0.1499 | 0.1879 | 0.2260 | 0.2640 | 0.3020 | 0.3401 | 0.3781 |
| Woodie | -0.3585 | -0.0668 | 0.0565 | 0.3483 | 0.4715 | 0.7633 | 0.8865 |
| Fibonacci | -0.0387 | 0.1199 | 0.2178 | 0.3763 | 0.5349 | 0.6328 | 0.7913 |
Numerical data
The following is the status of technical indicators and moving averages registered at the time this technical analysis was created:
| RSI (14): | 54.72 | |
| MACD (12,26,9): | 0.0022 | |
| Directional Movement: | -16.0948 | |
| AROON (14): | 78.5714 | |
| DEMA (21): | 0.2755 | |
| Parabolic SAR (0,02-0,02-0,2): | 0.2652 | |
| Elder Ray (13): | 0.0004 | |
| Super Trend (3,10): | 0.2588 | |
| Zig ZAG (10): | 0.2795 | |
| VORTEX (21): | 0.9155 | |
| Stochastique (14,3,5): | 58.54 | |
| TEMA (21): | 0.2767 | |
| Williams %R (14): | -24.39 | |
| Chande Momentum Oscillator (20): | 0.0085 | |
| Repulse (5,40,3): | 0.0656 | |
| ROCnROLL: | 1 | |
| TRIX (15,9): | 0.0789 | |
| Courbe Coppock: | 4.80 |
| MA7: | 0.2654 | |
| MA20: | 0.3726 | |
| MA50: | 0.4604 | |
| MA100: | 0.5472 | |
| MAexp7: | 0.2758 | |
| MAexp20: | 0.2729 | |
| MAexp50: | 0.2738 | |
| MAexp100: | 0.3014 | |
| Price / MA7: | +5.31% | |
| Price / MA20: | -24.99% | |
| Price / MA50: | -39.29% | |
| Price / MA100: | -48.92% | |
| Price / MAexp7: | +1.34% | |
| Price / MAexp20: | +2.42% | |
| Price / MAexp50: | +2.08% | |
| Price / MAexp100: | -7.27% |
News
The last news published on LYSOGENE at the time of the generation of this analysis was as follows:
- Lysogene announces the opening of a safeguard proceeding
- Lysogene Announces the Request for the Opening of a Safeguard Proceeding
- Lysogene Provides Updates and Topline Results from Phase 2/3 AAVance Gene Therapy Clinical Study
- Lysogene Provides Updates and Topline Results from Phase 2/3 AAVance Gene Therapy Clinical Study
- Lysogene to Provide Updates and Topline Results from Phase 2/3 AAVance Gene Therapy Clinical Study and Host Webcast on Wednesday, November 23, 2022
About author

Online


Add a comment
Comments
0 comments on the analysis LYSOGENE - 1H