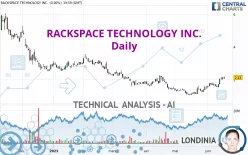
RACKSPACE TECHNOLOGY INC. - Daily - Technical analysis published on 06/19/2023 (GMT)
- 125
- 0
Click here for a new analysis!
- Timeframe : Daily
- - Analysis generated on
- Status : INVALID

Summary of the analysis

Additional analysis
Quotes
RACKSPACE TECHNOLOGY INC. rating 2.13 USD. On the day, this instrument gained +0.00% and was between 2.04 USD and 2.17 USD. This implies that the price is at +4.41% from its lowest and at -1.84% from its highest.The Central Gaps scanner detects a bullish opening marking the presence of buyers ahead of sellers at the opening but not sufficiently marked to allow the price to register a quotation gap.
Bullish opening
Type : Bullish
Timeframe : Openning
Here is a more detailed summary of the historical variations registered by RACKSPACE TECHNOLOGY INC.:
New HIGH record (1 month)
Type : Bullish
Timeframe : Weekly
The Central Volumes scanner detects abnormal volumes on the asset:
Abnormal volumes
Timeframe : 5 days
Technical
Technical analysis of RACKSPACE TECHNOLOGY INC. in Daily shows an overall bullish trend. 67.86% of the signals given by moving averages are bullish. The overall trend is reinforced by the strong bullish signals from short-term moving averages. The Central Indicators scanner detects a bullish signal on moving averages that could impact this trend:
Bullish trend reversal : adaptative moving average 100
Type : Bullish
Timeframe : Daily
In fact, according to the parameters integrated into the Central Analyzer system, 17 technical indicators out of 18 analysed are currently bullish. Caution: the Central Indicators scanner currently detects an excess:
CCI indicator is overbought : over 100
Type : Neutral
Timeframe : Daily
Williams %R indicator is overbought : over -20
Type : Neutral
Timeframe : Daily
Pivot points : price is over resistance 3
Type : Neutral
Timeframe : Weekly
No signals are given by Central Patterns, a market scanner specialised in chart patterns, resistances and supports.
The Central Candlesticks scanner, specialised in Japanese candlesticks, did not identify any signals.
| S2 | S1 | Price | R1 | R2 | R3 | |
|---|---|---|---|---|---|---|
| ProTrendLines | 1.09 | 1.66 | 2.13 | 2.24 | 3.80 | 4.36 |
| Change (%) | -48.83% | -22.07% | - | +5.16% | +78.40% | +104.69% |
| Change | -1.04 | -0.47 | - | +0.11 | +1.67 | +2.23 |
| Level | Major | Major | - | Major | Intermediate | Minor |
Attention could also be paid to pivot points to set price objectives:
| Pivot points | S3 | S2 | S1 | PP | R1 | R2 | R3 |
|---|---|---|---|---|---|---|---|
| Standard | 1.93 | 1.98 | 2.06 | 2.11 | 2.19 | 2.24 | 2.32 |
| Camarilla | 2.09 | 2.11 | 2.12 | 2.13 | 2.14 | 2.15 | 2.17 |
| Woodie | 1.94 | 1.99 | 2.07 | 2.12 | 2.20 | 2.25 | 2.33 |
| Fibonacci | 1.98 | 2.03 | 2.06 | 2.11 | 2.16 | 2.19 | 2.24 |
| Pivot points | S3 | S2 | S1 | PP | R1 | R2 | R3 |
|---|---|---|---|---|---|---|---|
| Standard | 1.06 | 1.29 | 1.71 | 1.94 | 2.36 | 2.59 | 3.01 |
| Camarilla | 1.95 | 2.01 | 2.07 | 2.13 | 2.19 | 2.25 | 2.31 |
| Woodie | 1.16 | 1.34 | 1.81 | 1.99 | 2.46 | 2.64 | 3.11 |
| Fibonacci | 1.29 | 1.54 | 1.69 | 1.94 | 2.19 | 2.34 | 2.59 |
| Pivot points | S3 | S2 | S1 | PP | R1 | R2 | R3 |
|---|---|---|---|---|---|---|---|
| Standard | 0.62 | 0.83 | 1.20 | 1.41 | 1.78 | 1.99 | 2.36 |
| Camarilla | 1.40 | 1.45 | 1.51 | 1.56 | 1.61 | 1.67 | 1.72 |
| Woodie | 0.69 | 0.87 | 1.27 | 1.45 | 1.85 | 2.03 | 2.43 |
| Fibonacci | 0.83 | 1.06 | 1.19 | 1.41 | 1.64 | 1.77 | 1.99 |
Numerical data
The following is the status of technical indicators and moving averages registered at the time this technical analysis was created:
| RSI (14): | 69.34 | |
| MACD (12,26,9): | 0.1600 | |
| Directional Movement: | 19.47 | |
| AROON (14): | 100.00 | |
| DEMA (21): | 1.89 | |
| Parabolic SAR (0,02-0,02-0,2): | 1.66 | |
| Elder Ray (13): | 0.29 | |
| Super Trend (3,10): | 1.55 | |
| Zig ZAG (10): | 2.13 | |
| VORTEX (21): | 1.2300 | |
| Stochastique (14,3,5): | 94.05 | |
| TEMA (21): | 2.08 | |
| Williams %R (14): | -5.06 | |
| Chande Momentum Oscillator (20): | 0.57 | |
| Repulse (5,40,3): | 12.7300 | |
| ROCnROLL: | 1 | |
| TRIX (15,9): | 0.8800 | |
| Courbe Coppock: | 81.24 |
| MA7: | 1.89 | |
| MA20: | 1.64 | |
| MA50: | 1.58 | |
| MA100: | 2.01 | |
| MAexp7: | 1.96 | |
| MAexp20: | 1.72 | |
| MAexp50: | 1.70 | |
| MAexp100: | 2.10 | |
| Price / MA7: | +12.70% | |
| Price / MA20: | +29.88% | |
| Price / MA50: | +34.81% | |
| Price / MA100: | +5.97% | |
| Price / MAexp7: | +8.67% | |
| Price / MAexp20: | +23.84% | |
| Price / MAexp50: | +25.29% | |
| Price / MAexp100: | +1.43% |
About author

Online


Add a comment
Comments
0 comments on the analysis RACKSPACE TECHNOLOGY INC. - Daily