| Open: | - |
| Change: | - |
| Volume: | - |
| Low: | - |
| High: | - |
| High / Low range: | - |
| Type: | Stocks |
| Ticker: | ENTG |
| ISIN: |
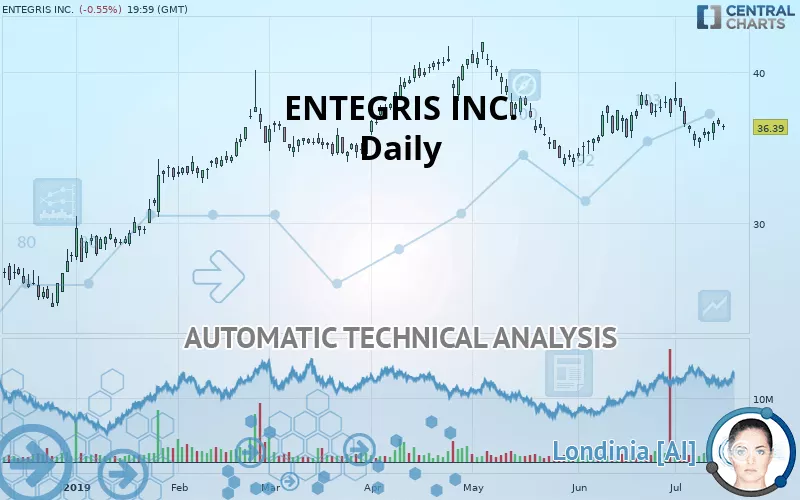
ENTEGRIS INC. - Daily - Technical analysis published on 07/17/2019 (GMT)
- 355
- 0
- 07/17/2019 - 12:06
- Who voted?
Click here for a new analysis!
- Timeframe : Daily
- - Analysis generated on 07/17/2019 - 12:05
- Status : INVALID
Summary of the analysis

Additional analysis
Quotes
The ENTEGRIS INC. rating is 36.39 USD. On the day, this instrument lost -0.55% and was traded between 36.14 USD and 36.60 USD over the period. The price is currently at +0.69% from its lowest and -0.57% from its highest.A bearish opening was detected by the Central Gaps scanner. Sellers are trying to impose a bearish trend in the very short term.
Bearish opening
Type : Bearish
Timeframe : Openning
So that you have an overall view of the price change, here is a table showing the variations over several periods:
Near a new LOW record (1 month)
Type : Bearish
Timeframe : Weekly
Technical
Technical analysis of ENTEGRIS INC. in Daily shows an overall slightly bearish trend. 53.57% of the signals given by moving averages are bearish. This bearish trend does not seem to be increasing given the slightly bearish signals given by short-term moving averages. An assessment of moving averages reveals a bullish signal that could impact this trend:
Moving Average bullish crossovers : MA20 & MA50
Type : Bullish
Timeframe : Daily
On the 18 technical indicators analysed, 4 are bullish, 7 are neutral and 7 are bearish. But beware of excesses. The Central Indicators scanner currently detects this:
Williams %R indicator is overbought : over -20
Type : Neutral
Timeframe : Daily
Ichimoku - Bearish crossover : Tenkan & Kijun
Type : Bearish
Timeframe : Daily
Price is back over the pivot point
Type : Bullish
Timeframe : Weekly
Price is back under the pivot point
Type : Bearish
Timeframe : Daily
No signals are given by Central Patterns, a market scanner specialised in chart patterns, resistances and supports.
No result was found by the Central Candlesticks scanner on Japanese candlesticks.
| S3 | S2 | S1 | Price | R1 | R2 | |
|---|---|---|---|---|---|---|
| ProTrendLines | 28.31 | 30.29 | 34.36 | 36.39 | 38.85 | 41.99 |
| Change (%) | -22.20% | -16.76% | -5.58% | - | +6.76% | +15.39% |
| Change | -8.08 | -6.10 | -2.03 | - | +2.46 | +5.60 |
| Level | Minor | Intermediate | Major | - | Major | Major |
Attention could also be paid to pivot points to set price objectives:
| Pivot points | S3 | S2 | S1 | PP | R1 | R2 | R3 |
|---|---|---|---|---|---|---|---|
| Standard | 35.77 | 36.09 | 36.34 | 36.66 | 36.91 | 37.23 | 37.48 |
| Camarilla | 36.43 | 36.49 | 36.54 | 36.59 | 36.64 | 36.70 | 36.75 |
| Woodie | 35.74 | 36.07 | 36.31 | 36.64 | 36.88 | 37.21 | 37.45 |
| Fibonacci | 36.09 | 36.31 | 36.44 | 36.66 | 36.88 | 37.01 | 37.23 |
| Pivot points | S3 | S2 | S1 | PP | R1 | R2 | R3 |
|---|---|---|---|---|---|---|---|
| Standard | 33.71 | 34.36 | 35.50 | 36.15 | 37.29 | 37.94 | 39.08 |
| Camarilla | 36.16 | 36.32 | 36.49 | 36.65 | 36.81 | 36.98 | 37.14 |
| Woodie | 33.97 | 34.48 | 35.76 | 36.27 | 37.55 | 38.06 | 39.34 |
| Fibonacci | 34.36 | 35.04 | 35.46 | 36.15 | 36.83 | 37.25 | 37.94 |
| Pivot points | S3 | S2 | S1 | PP | R1 | R2 | R3 |
|---|---|---|---|---|---|---|---|
| Standard | 29.99 | 32.00 | 34.66 | 36.67 | 39.33 | 41.34 | 44.00 |
| Camarilla | 36.04 | 36.46 | 36.89 | 37.32 | 37.75 | 38.18 | 38.60 |
| Woodie | 30.32 | 32.16 | 34.99 | 36.83 | 39.66 | 41.50 | 44.33 |
| Fibonacci | 32.00 | 33.78 | 34.89 | 36.67 | 38.45 | 39.56 | 41.34 |
Numerical data
The following is the status of technical indicators and moving averages registered at the time this technical analysis was created:
| RSI (14): | 47.65 | |
| MACD (12,26,9): | -0.1800 | |
| Directional Movement: | -1.68 | |
| AROON (14): | -35.72 | |
| DEMA (21): | 36.44 | |
| Parabolic SAR (0,02-0,02-0,2): | 37.59 | |
| Elder Ray (13): | -0.17 | |
| Super Trend (3,10): | 35.09 | |
| Zig ZAG (10): | 36.39 | |
| VORTEX (21): | 0.9500 | |
| Stochastique (14,3,5): | 35.28 | |
| TEMA (21): | 36.38 | |
| Williams %R (14): | -68.23 | |
| Chande Momentum Oscillator (20): | -1.66 | |
| Repulse (5,40,3): | 0.7700 | |
| ROCnROLL: | 2 | |
| TRIX (15,9): | -0.0300 | |
| Courbe Coppock: | 6.42 |
| MA7: | 36.11 | |
| MA20: | 37.00 | |
| MA50: | 36.82 | |
| MA100: | 37.16 | |
| MAexp7: | 36.41 | |
| MAexp20: | 36.64 | |
| MAexp50: | 36.81 | |
| MAexp100: | 36.18 | |
| Price / MA7: | +0.78% | |
| Price / MA20: | -1.65% | |
| Price / MA50: | -1.17% | |
| Price / MA100: | -2.07% | |
| Price / MAexp7: | -0.05% | |
| Price / MAexp20: | -0.68% | |
| Price / MAexp50: | -1.14% | |
| Price / MAexp100: | +0.58% |
News
The latest news and videos published on ENTEGRIS INC. at the time of the analysis were as follows:
- 02/06/2018 - 07:15 Entegris, Inc. to Host Earnings Call
- 01/22/2018 - 13:30 Entegris Acquires Particle Sizing Systems, LLC To Expand The Value Of Its Product Portfolio For Advanced-Node Manufacturers
- 11/03/2017 - 00:33 Entegris Announces Pricing Of $550 Million Upsized Offering Of 4.625% Senior Unsecured Notes
- 11/01/2017 - 20:10 Entegris Announces Proposed $450 Million Senior Unsecured Notes Offering
- 10/26/2017 - 10:00 Entegris Reports Strong Third-Quarter Results
About author

Online


Add a comment
Comments
0 comments on the analysis ENTEGRIS INC. - Daily