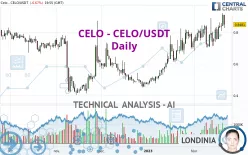
CELO - CELO/USDT - Daily - Technical analysis published on 02/21/2023 (GMT)
- 279
- 0
Click here for a new analysis!
- Timeframe : Daily
- - Analysis generated on
- Status : INVALID

Summary of the analysis

Additional analysis
Quotes
The CELO - CELO/USDT rating is 0.848100 USDT. On the day, this instrument lost -6.67% and was between 0.827300 USDT and 0.909000 USDT. This implies that the price is at +2.51% from its lowest and at -6.70% from its highest.A bearish opening was detected by the Central Gaps scanner. Sellers are trying to impose a bearish trend in the very short term.
Bearish opening
Type : Bearish
Timeframe : Openning
Here is a more detailed summary of the historical variations registered by CELO - CELO/USDT:
Near a new HIGH record (1st january)
Type : Bullish
Timeframe : Weekly
Near a new HIGH record (1 month)
Type : Bullish
Timeframe : Weekly
Technical
A technical analysis in Daily of this CELO - CELO/USDT chart shows a strongly bullish trend. 92.86% of the signals given by moving averages are bullish. The overall trend is supported by the strong bullish signals from short-term moving averages. The Central Indicators market scanner currently does not detect any result that concerns moving averages.
In fact, 13 technical indicators on 18 studied are currently positioned bullish. But beware of excesses. The Central Indicators scanner currently detects this:
CCI indicator is overbought : over 100
Type : Neutral
Timeframe : Daily
Previous candle closed over Bollinger bands
Type : Neutral
Timeframe : Daily
Pivot points : price is under support 1
Type : Neutral
Timeframe : Daily
No signals are given by Central Patterns, a market scanner specialised in chart patterns, resistances and supports.
For a small setback in the very short term, the Central Candlesticks scanner currently notes the presence of this bearish pattern in Japanese candlesticks:
Bearish harami
Type : Bearish
Timeframe : Daily
| S3 | S2 | S1 | Price | R1 | R2 | R3 | |
|---|---|---|---|---|---|---|---|
| ProTrendLines | 0.458900 | 0.680900 | 0.788183 | 0.848100 | 1.148000 | 1.935200 | 3.325000 |
| Change (%) | -45.89% | -19.71% | -7.06% | - | +35.36% | +128.18% | +292.05% |
| Change | -0.389200 | -0.167200 | -0.059917 | - | +0.299900 | +1.087100 | +2.476900 |
| Level | Minor | Minor | Major | - | Intermediate | Minor | Minor |
Pivot points can also be used to set your price objectives. Here is the price situation in relation to pivot points:
| Pivot points | S3 | S2 | S1 | PP | R1 | R2 | R3 |
|---|---|---|---|---|---|---|---|
| Standard | 0.775400 | 0.807100 | 0.857900 | 0.889600 | 0.940400 | 0.972100 | 1.022900 |
| Camarilla | 0.886013 | 0.893575 | 0.901138 | 0.908700 | 0.916263 | 0.923825 | 0.931388 |
| Woodie | 0.784950 | 0.811875 | 0.867450 | 0.894375 | 0.949950 | 0.976875 | 1.032450 |
| Fibonacci | 0.807100 | 0.838615 | 0.858085 | 0.889600 | 0.921115 | 0.940585 | 0.972100 |
| Pivot points | S3 | S2 | S1 | PP | R1 | R2 | R3 |
|---|---|---|---|---|---|---|---|
| Standard | 0.555767 | 0.633433 | 0.734867 | 0.812533 | 0.913967 | 0.991633 | 1.093067 |
| Camarilla | 0.787048 | 0.803465 | 0.819883 | 0.836300 | 0.852718 | 0.869135 | 0.885553 |
| Woodie | 0.567650 | 0.639375 | 0.746750 | 0.818475 | 0.925850 | 0.997575 | 1.104950 |
| Fibonacci | 0.633433 | 0.701850 | 0.744117 | 0.812533 | 0.880950 | 0.923217 | 0.991633 |
| Pivot points | S3 | S2 | S1 | PP | R1 | R2 | R3 |
|---|---|---|---|---|---|---|---|
| Standard | 0.185500 | 0.330800 | 0.532100 | 0.677400 | 0.878700 | 1.024000 | 1.225300 |
| Camarilla | 0.638085 | 0.669857 | 0.701628 | 0.733400 | 0.765172 | 0.796943 | 0.828715 |
| Woodie | 0.213500 | 0.344800 | 0.560100 | 0.691400 | 0.906700 | 1.038000 | 1.253300 |
| Fibonacci | 0.330800 | 0.463201 | 0.544999 | 0.677400 | 0.809801 | 0.891599 | 1.024000 |
Numerical data
The following are the details of the technical indicators and moving averages that were collected to generate this technical analysis:
| RSI (14): | 56.75 | |
| MACD (12,26,9): | 0.0385 | |
| Directional Movement: | 17.912864 | |
| AROON (14): | 71.428572 | |
| DEMA (21): | 0.847352 | |
| Parabolic SAR (0,02-0,02-0,2): | 0.734627 | |
| Elder Ray (13): | 0.052305 | |
| Super Trend (3,10): | 0.664873 | |
| Zig ZAG (10): | 0.845300 | |
| VORTEX (21): | 1.0850 | |
| Stochastique (14,3,5): | 78.12 | |
| TEMA (21): | 0.849086 | |
| Williams %R (14): | -34.05 | |
| Chande Momentum Oscillator (20): | 0.123100 | |
| Repulse (5,40,3): | -0.0112 | |
| ROCnROLL: | 1 | |
| TRIX (15,9): | 0.6615 | |
| Courbe Coppock: | 14.81 |
| MA7: | 0.833714 | |
| MA20: | 0.795740 | |
| MA50: | 0.706850 | |
| MA100: | 0.619033 | |
| MAexp7: | 0.837433 | |
| MAexp20: | 0.796564 | |
| MAexp50: | 0.728039 | |
| MAexp100: | 0.691286 | |
| Price / MA7: | +1.73% | |
| Price / MA20: | +6.58% | |
| Price / MA50: | +19.98% | |
| Price / MA100: | +37.00% | |
| Price / MAexp7: | +1.27% | |
| Price / MAexp20: | +6.47% | |
| Price / MAexp50: | +16.49% | |
| Price / MAexp100: | +22.68% |
About author

Online


Add a comment
Comments
0 comments on the analysis CELO - CELO/USDT - Daily