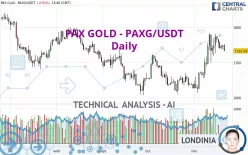
PAX GOLD - PAXG/USDT - Daily - Technical analysis published on 11/21/2022 (GMT)
- 181
- 0
Click here for a new analysis!
- Timeframe : Daily
- - Analysis generated on
- Status : TARGET REACHED

Summary of the analysis

Additional analysis
Quotes
The PAX GOLD - PAXG/USDT price is 1,733.19 USDT. On the day, this instrument lost -0.91% and was traded between 1,732.12 USDT and 1,752.27 USDT over the period. The price is currently at +0.06% from its lowest and -1.09% from its highest.The Central Gaps scanner detects a bearish opening marking the presence of sellers ahead of buyers at the opening but not sufficiently marked to allow the price to register a quotation gap.
Bearish opening
Type : Bearish
Timeframe : Openning
So that you have an overall view of the price change, here is a table showing the variations over several periods:
Near a new HIGH record (1 month)
Type : Bullish
Timeframe : Weekly
Technical
Technical analysis of PAX GOLD - PAXG/USDT in Daily shows an overall bullish trend. 75.00% of the signals given by moving averages are bullish. This bullish trend is supported by the strong bullish signals given by short-term moving averages. There is no crossing of moving average by the price or crossing of moving averages between themselves.
In fact, only 9 technical indicators out of 18 studied are currently positioned bullish. Other results related to technical indicators were also found by the Central Indicators scanner:
Pivot points : price is under support 2
Type : Neutral
Timeframe : Daily
MACD crosses DOWN its Moving Average
Type : Bearish
Timeframe : Daily
Parabolic SAR indicator bearish reversal
Type : Bearish
Timeframe : Daily
The Central Patterns scanner, which studies chart patterns, resistances and supports, has identified this signal:
Near horizontal resistance
Type : Bearish
Timeframe : Daily
No result was found by the Central Candlesticks scanner on Japanese candlesticks.
| S3 | S2 | S1 | Price | R1 | R2 | R3 | |
|---|---|---|---|---|---|---|---|
| ProTrendLines | 1,657.79 | 1,700.12 | 1,720.23 | 1,733.19 | 1,752.43 | 1,796.54 | 1,836.63 |
| Change (%) | -4.35% | -1.91% | -0.75% | - | +1.11% | +3.66% | +5.97% |
| Change | -75.40 | -33.07 | -12.96 | - | +19.24 | +63.35 | +103.44 |
| Level | Minor | Major | Major | - | Intermediate | Major | Minor |
To determine price objectives, it is also possible to use the pivot points. Here is the price position in relation to pivot points:
| Pivot points | S3 | S2 | S1 | PP | R1 | R2 | R3 |
|---|---|---|---|---|---|---|---|
| Standard | 1,728.42 | 1,732.84 | 1,740.96 | 1,745.38 | 1,753.50 | 1,757.92 | 1,766.04 |
| Camarilla | 1,745.64 | 1,746.79 | 1,747.94 | 1,749.09 | 1,750.24 | 1,751.39 | 1,752.54 |
| Woodie | 1,730.28 | 1,733.77 | 1,742.82 | 1,746.31 | 1,755.36 | 1,758.85 | 1,767.90 |
| Fibonacci | 1,732.84 | 1,737.63 | 1,740.59 | 1,745.38 | 1,750.17 | 1,753.13 | 1,757.92 |
| Pivot points | S3 | S2 | S1 | PP | R1 | R2 | R3 |
|---|---|---|---|---|---|---|---|
| Standard | 1,652.51 | 1,685.39 | 1,716.09 | 1,748.97 | 1,779.67 | 1,812.55 | 1,843.25 |
| Camarilla | 1,729.30 | 1,735.12 | 1,740.95 | 1,746.78 | 1,752.61 | 1,758.44 | 1,764.27 |
| Woodie | 1,651.41 | 1,684.85 | 1,714.99 | 1,748.43 | 1,778.57 | 1,812.01 | 1,842.15 |
| Fibonacci | 1,685.39 | 1,709.68 | 1,724.69 | 1,748.97 | 1,773.26 | 1,788.27 | 1,812.55 |
| Pivot points | S3 | S2 | S1 | PP | R1 | R2 | R3 |
|---|---|---|---|---|---|---|---|
| Standard | 1,472.12 | 1,541.23 | 1,584.34 | 1,653.45 | 1,696.56 | 1,765.67 | 1,808.78 |
| Camarilla | 1,596.60 | 1,606.89 | 1,617.17 | 1,627.46 | 1,637.75 | 1,648.03 | 1,658.32 |
| Woodie | 1,459.13 | 1,534.73 | 1,571.35 | 1,646.95 | 1,683.57 | 1,759.17 | 1,795.79 |
| Fibonacci | 1,541.23 | 1,584.10 | 1,610.58 | 1,653.45 | 1,696.32 | 1,722.80 | 1,765.67 |
Numerical data
The following are the details of the technical indicators and moving averages that were collected to generate this technical analysis:
| RSI (14): | 55.99 | |
| MACD (12,26,9): | 23.7500 | |
| Directional Movement: | 8.17 | |
| AROON (14): | 28.57 | |
| DEMA (21): | 1,753.22 | |
| Parabolic SAR (0,02-0,02-0,2): | 1,783.20 | |
| Elder Ray (13): | 6.71 | |
| Super Trend (3,10): | 1,670.08 | |
| Zig ZAG (10): | 1,733.21 | |
| VORTEX (21): | 1.1600 | |
| Stochastique (14,3,5): | 68.42 | |
| TEMA (21): | 1,766.49 | |
| Williams %R (14): | -39.51 | |
| Chande Momentum Oscillator (20): | 36.51 | |
| Repulse (5,40,3): | -0.8800 | |
| ROCnROLL: | -1 | |
| TRIX (15,9): | 0.2200 | |
| Courbe Coppock: | 9.44 |
| MA7: | 1,752.54 | |
| MA20: | 1,716.94 | |
| MA50: | 1,681.34 | |
| MA100: | 1,690.12 | |
| MAexp7: | 1,744.38 | |
| MAexp20: | 1,722.66 | |
| MAexp50: | 1,697.34 | |
| MAexp100: | 1,704.89 | |
| Price / MA7: | -1.10% | |
| Price / MA20: | +0.95% | |
| Price / MA50: | +3.08% | |
| Price / MA100: | +2.55% | |
| Price / MAexp7: | -0.64% | |
| Price / MAexp20: | +0.61% | |
| Price / MAexp50: | +2.11% | |
| Price / MAexp100: | +1.66% |
About author

Online


Add a comment
Comments
0 comments on the analysis PAX GOLD - PAXG/USDT - Daily