KUSAMA - KSM/USDT overview
KUSAMA - KSM/USDT
> Analyses

 Thank you
Reply
Chart
Thank you
Reply
Chart
Londinia
has published a new analysis for mickaastrup.
- 0
- 93290
- 15787
- 0
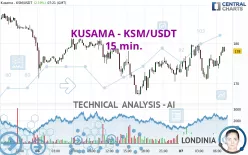
Timeframe : 15 min. - Simple chart
Status : NEUTRAL
The basic trend is slightly bullish and the short term is tentatively bearish. With such a pattern, the price could just as easily move towards the first support as the first resistance. The first…
KUSAMA - KSM/USDT
> Analyses
 Thank you
Reply
Chart
Thank you
Reply
Chart
Londinia
has published a new analysis for mickaastrup.
- 0
- 93290
- 15787
- 0
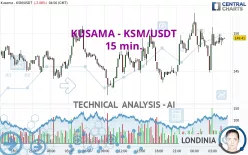
Timeframe : 15 min. - Simple chart
Status : TARGET REACHED
KUSAMA - KSM/USDT is part of a very strong bullish trend. Traders may consider trading only long positions (at the time of purchase) as long as the price remains well above 174.18 USDT. The next…
KUSAMA - KSM/USDT
> Analyses
 Thank you
Reply
Chart
Thank you
Reply
Chart
Londinia
has published a new analysis for mickaastrup.
- 0
- 93290
- 15787
- 0
Timeframe : 15 min. - Simple chart
Status : LEVEL MAINTAINED
A bullish trend on KUSAMA - KSM/USDT both in substance and in the short term. A purchase could be considered as long as the price remains above 149.02 USDT. Each resistance break is a strong signal…
KUSAMA - KSM/USDT
> Analyses
 Thank you
Reply
Chart
Thank you
Reply
Chart
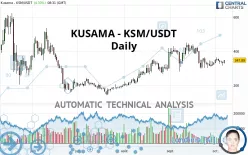
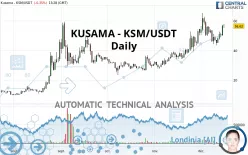
Timeframe : Daily - Simple chart
Status : LEVEL MAINTAINED
A bullish trend on KUSAMA - KSM/USDT both in substance and in the short term. A purchase could be considered as long as the price remains above 304.29 USDT. Each resistance break is a strong signal…
KUSAMA - KSM/USDT
> Analyses
 Thank you
Reply
Chart
Thank you
Reply
Chart
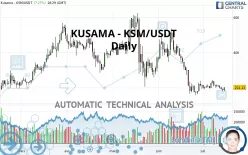
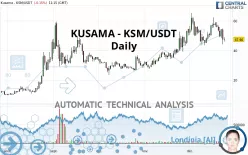
Timeframe : Daily - Simple chart
Status : TARGET REACHED
The bearish basic trend is very strong on KUSAMA - KSM/USDT but the short term shows some signs of running out of steam. However, a sale could be considered as long as the price remains below 215.14…
KUSAMA - KSM/USDT
> Analyses
 Thank you
Reply
Chart
Thank you
Reply
Chart
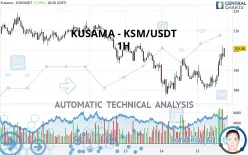
Timeframe : 1H - Simple chart
Status : TARGET REACHED
The short-term increase currently reinforces the basic trend, which is only slightly bullish. It would be possible for traders to only trade long positions (at the time of purchase) on KUSAMA -…
KUSAMA - KSM/USDT
> Analyses
 Thank you
Reply
Chart
Thank you
Reply
Chart
Timeframe : Daily - Simple chart
Status : TARGET REACHED
Has the basic bullish trend slowed or is it lacking in power? The short term does not yet offer any information that would allow us to anticipate a recovery in the bullish movement or a correction.…
KUSAMA - KSM/USDT
> Analyses
 Thank you
Reply
Chart
Thank you
Reply
Chart
Timeframe : Daily - Simple chart
Status : TARGET REACHED
The bullish trend is currently very strong on KUSAMA - KSM/USDT. As long as the price remains above the support at 50.67 USDT, you could try to benefit from the boom. The first bullish objective is…

