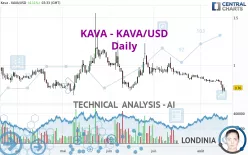
KAVA - KAVA/USD - Daily - Technical analysis published on 08/17/2023 (GMT)
- 215
- 0
Click here for a new analysis!
- Timeframe : Daily
- - Analysis generated on
- Status : TARGET REACHED

Summary of the analysis

Additional analysis
Quotes
The KAVA - KAVA/USD rating is 0.760000 USD. The price has increased by +4.11% since the last closing and was traded between 0.720000 USD and 0.760000 USD over the period. The price is currently at +5.56% from its lowest and 0% from its highest.So that you have an overall view of the price change, here is a table showing the variations over several periods:
Near a new LOW record (1 month)
Type : Bearish
Timeframe : Weekly
Technical
A technical analysis in Daily of this KAVA - KAVA/USD chart shows a sharp bearish trend. The signals given by moving averages are 92.86% bearish. This strong bearish trend is confirmed by the strong signals currently being given by short-term moving averages. The Central Indicators scanner detects a bearish signal on moving averages that could impact this trend:
Bearish trend reversal : Moving Average 100
Type : Bearish
Timeframe : Daily
The probability of a further decline is high given the direction of the technical indicators.
Caution: the Central Indicators scanner currently detects an excess:
RSI indicator is oversold : under 30
Type : Neutral
Timeframe : Daily
CCI indicator is oversold : under -100
Type : Neutral
Timeframe : Daily
Previous candle closed under Bollinger bands
Type : Neutral
Timeframe : Daily
Pivot points : price is under support 3
Type : Neutral
Timeframe : Weekly
Price is back over the pivot point
Type : Bullish
Timeframe : Daily
Central Patterns, the market scanner focusing on chart patterns, resistances and supports found this result:
Horizontal support is broken
Type : Bearish
Timeframe : Daily
The Central Candlesticks scanner which studies Japanese candlesticks did not detect anything.
| S1 | R1 | Price | R2 | R3 | |
|---|---|---|---|---|---|
| ProTrendLines | 0.648889 | 0.760000 | 0.760000 | 0.850000 | 0.950000 |
| Change (%) | -14.62% | 0% | - | +11.84% | +25.00% |
| Change | -0.111111 | 0 | - | +0.090000 | +0.190000 |
| Level | Intermediate | Intermediate | - | Intermediate | Minor |
Attention could also be paid to pivot points to set price objectives:
| Pivot points | S3 | S2 | S1 | PP | R1 | R2 | R3 |
|---|---|---|---|---|---|---|---|
| Standard | 0.616667 | 0.663333 | 0.696667 | 0.743333 | 0.776667 | 0.823333 | 0.856667 |
| Camarilla | 0.708000 | 0.715333 | 0.722667 | 0.730000 | 0.737333 | 0.744667 | 0.752000 |
| Woodie | 0.610000 | 0.660000 | 0.690000 | 0.740000 | 0.770000 | 0.820000 | 0.850000 |
| Fibonacci | 0.663333 | 0.693893 | 0.712773 | 0.743333 | 0.773893 | 0.792773 | 0.823333 |
| Pivot points | S3 | S2 | S1 | PP | R1 | R2 | R3 |
|---|---|---|---|---|---|---|---|
| Standard | 0.776667 | 0.793333 | 0.816667 | 0.833333 | 0.856667 | 0.873333 | 0.896667 |
| Camarilla | 0.829000 | 0.832667 | 0.836333 | 0.840000 | 0.843667 | 0.847333 | 0.851000 |
| Woodie | 0.780000 | 0.795000 | 0.820000 | 0.835000 | 0.860000 | 0.875000 | 0.900000 |
| Fibonacci | 0.793333 | 0.808613 | 0.818053 | 0.833333 | 0.848613 | 0.858053 | 0.873333 |
| Pivot points | S3 | S2 | S1 | PP | R1 | R2 | R3 |
|---|---|---|---|---|---|---|---|
| Standard | 0.540000 | 0.690000 | 0.780000 | 0.930000 | 1.020000 | 1.170000 | 1.260000 |
| Camarilla | 0.804000 | 0.826000 | 0.848000 | 0.870000 | 0.892000 | 0.914000 | 0.936000 |
| Woodie | 0.510000 | 0.675000 | 0.750000 | 0.915000 | 0.990000 | 1.155000 | 1.230000 |
| Fibonacci | 0.690000 | 0.781680 | 0.838320 | 0.930000 | 1.021680 | 1.078320 | 1.170000 |
Numerical data
The following are the details of the technical indicators and moving averages that were collected to generate this technical analysis:
| RSI (14): | 28.98 | |
| MACD (12,26,9): | -0.0321 | |
| Directional Movement: | -19.812960 | |
| AROON (14): | -92.857143 | |
| DEMA (21): | 0.786190 | |
| Parabolic SAR (0,02-0,02-0,2): | 0.830000 | |
| Elder Ray (13): | -0.068560 | |
| Super Trend (3,10): | 0.847350 | |
| Zig ZAG (10): | 0.750000 | |
| VORTEX (21): | 0.7581 | |
| Stochastique (14,3,5): | 21.78 | |
| TEMA (21): | 0.772116 | |
| Williams %R (14): | -71.43 | |
| Chande Momentum Oscillator (20): | -0.080000 | |
| Repulse (5,40,3): | -4.5575 | |
| ROCnROLL: | 2 | |
| TRIX (15,9): | -0.4134 | |
| Courbe Coppock: | 15.78 |
| MA7: | 0.800000 | |
| MA20: | 0.832500 | |
| MA50: | 0.889400 | |
| MA100: | 0.926900 | |
| MAexp7: | 0.786877 | |
| MAexp20: | 0.825923 | |
| MAexp50: | 0.867836 | |
| MAexp100: | 0.888438 | |
| Price / MA7: | -5.00% | |
| Price / MA20: | -8.71% | |
| Price / MA50: | -14.55% | |
| Price / MA100: | -18.01% | |
| Price / MAexp7: | -3.42% | |
| Price / MAexp20: | -7.98% | |
| Price / MAexp50: | -12.43% | |
| Price / MAexp100: | -14.46% |
About author
Online


Add a comment
Comments
0 comments on the analysis KAVA - KAVA/USD - Daily