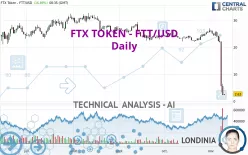
FTX TOKEN - FTT/USD - Daily - Technical analysis published on 11/10/2022 (GMT)
- 269
- 0
- Timeframe : Daily
- - Analysis generated on
- Status : WITHOUT TARGET

Summary of the analysis

Additional analysis
Quotes
FTX TOKEN - FTT/USD rating 2.63 USD. On the day, this instrument gained +16.89% and was between 2.16 USD and 2.65 USD. This implies that the price is at +21.76% from its lowest and at -0.75% from its highest.The Central Gaps scanner detects a bearish opening marking the presence of sellers ahead of buyers at the opening but not sufficiently marked to allow the price to register a quotation gap.
Bearish opening
Type : Bearish
Timeframe : Openning
A study of price movements over other periods shows the following variations:
Abnormal volumes
Timeframe : 5 days
Technical
A technical analysis in Daily of this FTX TOKEN - FTT/USD chart shows a sharp bearish trend. The signals given by moving averages are 92.86% bearish. This strong bearish trend is confirmed by the strong signals currently being given by short-term moving averages. The Central Indicators market scanner currently does not detect any result that concerns moving averages.
In fact, according to the parameters integrated into the Central Analyzer system, 12 technical indicators out of 18 analysed are currently bearish. Caution: the Central Indicators scanner currently detects an excess:
RSI indicator is oversold : under 20
Type : Neutral
Timeframe : Daily
CCI indicator is oversold : under -100
Type : Neutral
Timeframe : Daily
Previous candle closed under Bollinger bands
Type : Neutral
Timeframe : Daily
Williams %R indicator is oversold : under -80
Type : Neutral
Timeframe : Daily
Pivot points : price is under support 3
Type : Neutral
Timeframe : Weekly
No signals are given by Central Patterns, a market scanner specialised in chart patterns, resistances and supports.
The Central Candlesticks scanner which studies Japanese candlesticks did not detect anything.
| Price | R1 | R2 | R3 | |
|---|---|---|---|---|
| ProTrendLines | 2.63 | 3.84 | 22.81 | 26.06 |
| Change (%) | - | +46.01% | +767.30% | +890.87% |
| Change | - | +1.21 | +20.18 | +23.43 |
| Level | - | Major | Major | Major |
Attention could also be paid to pivot points to set price objectives:
| Pivot points | S3 | S2 | S1 | PP | R1 | R2 | R3 |
|---|---|---|---|---|---|---|---|
| Standard | -3.82 | -0.92 | 0.66 | 3.56 | 5.14 | 8.04 | 9.62 |
| Camarilla | 1.02 | 1.43 | 1.84 | 2.25 | 2.66 | 3.07 | 3.48 |
| Woodie | -4.47 | -1.25 | 0.01 | 3.23 | 4.49 | 7.71 | 8.97 |
| Fibonacci | -0.92 | 0.79 | 1.85 | 3.56 | 5.27 | 6.33 | 8.04 |
| Pivot points | S3 | S2 | S1 | PP | R1 | R2 | R3 |
|---|---|---|---|---|---|---|---|
| Standard | 19.84 | 21.86 | 22.96 | 24.98 | 26.08 | 28.10 | 29.20 |
| Camarilla | 23.21 | 23.50 | 23.78 | 24.07 | 24.36 | 24.64 | 24.93 |
| Woodie | 19.39 | 21.63 | 22.51 | 24.75 | 25.63 | 27.87 | 28.75 |
| Fibonacci | 21.86 | 23.05 | 23.79 | 24.98 | 26.17 | 26.91 | 28.10 |
| Pivot points | S3 | S2 | S1 | PP | R1 | R2 | R3 |
|---|---|---|---|---|---|---|---|
| Standard | 18.05 | 20.02 | 23.06 | 25.03 | 28.07 | 30.04 | 33.08 |
| Camarilla | 24.73 | 25.19 | 25.65 | 26.11 | 26.57 | 27.03 | 27.49 |
| Woodie | 18.60 | 20.29 | 23.61 | 25.30 | 28.62 | 30.31 | 33.63 |
| Fibonacci | 20.02 | 21.93 | 23.11 | 25.03 | 26.94 | 28.12 | 30.04 |
Numerical data
The following are the details of the technical indicators and moving averages that were collected to generate this technical analysis:
| RSI (14): | 10.95 | |
| MACD (12,26,9): | -4.0300 | |
| Directional Movement: | -49.96 | |
| AROON (14): | -64.29 | |
| DEMA (21): | 14.55 | |
| Parabolic SAR (0,02-0,02-0,2): | 22.12 | |
| Elder Ray (13): | -14.06 | |
| Super Trend (3,10): | 11.53 | |
| Zig ZAG (10): | 2.31 | |
| VORTEX (21): | 0.5800 | |
| Stochastique (14,3,5): | 4.68 | |
| TEMA (21): | 11.05 | |
| Williams %R (14): | -98.72 | |
| Chande Momentum Oscillator (20): | -23.19 | |
| Repulse (5,40,3): | -309.9100 | |
| ROCnROLL: | 2 | |
| TRIX (15,9): | -0.7200 | |
| Courbe Coppock: | 83.76 |
| MA7: | 14.86 | |
| MA20: | 21.12 | |
| MA50: | 22.74 | |
| MA100: | 25.15 | |
| MAexp7: | 11.77 | |
| MAexp20: | 18.67 | |
| MAexp50: | 22.04 | |
| MAexp100: | 24.46 | |
| Price / MA7: | -82.30% | |
| Price / MA20: | -87.55% | |
| Price / MA50: | -88.43% | |
| Price / MA100: | -89.54% | |
| Price / MAexp7: | -77.66% | |
| Price / MAexp20: | -85.91% | |
| Price / MAexp50: | -88.07% | |
| Price / MAexp100: | -89.25% |
About author
Online


Add a comment
Comments
0 comments on the analysis FTX TOKEN - FTT/USD - Daily