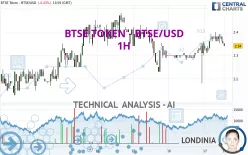
BTSE TOKEN - BTSE/USD - 1H - Technical analysis published on 03/17/2023 (GMT)
- 157
- 0
- Timeframe : 1H
- - Analysis generated on
- Status : NEUTRAL

Summary of the analysis
Additional analysis
Quotes
The BTSE TOKEN - BTSE/USD price is 2.34 USD. The price is lower by -0.43% since the last closing and was between 2.31 USD and 2.40 USD. This implies that the price is at +1.30% from its lowest and at -2.50% from its highest.The Central Gaps scanner detects a bearish opening. A small advantage for sellers in the very short term.
Bearish opening
Type : Bearish
Timeframe : Openning
A study of price movements over other periods shows the following variations:
Abnormal volumes
Timeframe : 20 days
Abnormal volumes
Timeframe : 50 days
Technical
Technical analysis of BTSE TOKEN - BTSE/USD in 1H shows an overall slightly bullish trend. 50.00% of the signals given by moving averages are bullish. As the signals currently given by short-term moving averages are rather neutral, the overall trend could quickly return to neutral as well. The Central Indicators scanner detects bearish signals on moving averages that could impact this trend:
Bearish price crossover with Moving Average 20
Type : Bearish
Timeframe : 1 hour
Bearish price crossover with adaptative moving average 20
Type : Bearish
Timeframe : 1 hour
An assessment of technical indicators does not currently provide any relevant information on the direction of future price movements.
Other results related to technical indicators were also found by the Central Indicators scanner:
RSI indicator is back under 50
Type : Bearish
Timeframe : 1 hour
MACD crosses DOWN its Moving Average
Type : Bearish
Timeframe : 1 hour
Price is back over the pivot point
Type : Bullish
Timeframe : Weekly
The analysis of the price chart with Central Patterns scanners does not return any result.
The Central Candlesticks scanner, specialised in Japanese candlesticks, did not identify any signals.
| S3 | S2 | S1 | Price | R1 | R2 | R3 | |
|---|---|---|---|---|---|---|---|
| ProTrendLines | 2.23 | 2.27 | 2.34 | 2.34 | 2.37 | 2.43 | 2.48 |
| Change (%) | -4.70% | -2.99% | 0% | - | +1.28% | +3.85% | +5.98% |
| Change | -0.11 | -0.07 | 0 | - | +0.03 | +0.09 | +0.14 |
| Level | Minor | Intermediate | Major | - | Minor | Minor | Intermediate |
To determine price objectives, it is also possible to use the pivot points. Here is the price position in relation to pivot points:
| Pivot points | S3 | S2 | S1 | PP | R1 | R2 | R3 |
|---|---|---|---|---|---|---|---|
| Standard | 2.05 | 2.12 | 2.23 | 2.30 | 2.41 | 2.48 | 2.59 |
| Camarilla | 2.30 | 2.32 | 2.33 | 2.35 | 2.37 | 2.38 | 2.40 |
| Woodie | 2.08 | 2.13 | 2.26 | 2.31 | 2.44 | 2.49 | 2.62 |
| Fibonacci | 2.12 | 2.19 | 2.23 | 2.30 | 2.37 | 2.41 | 2.48 |
| Pivot points | S3 | S2 | S1 | PP | R1 | R2 | R3 |
|---|---|---|---|---|---|---|---|
| Standard | 1.22 | 1.61 | 1.92 | 2.31 | 2.62 | 3.01 | 3.32 |
| Camarilla | 2.04 | 2.10 | 2.17 | 2.23 | 2.29 | 2.36 | 2.42 |
| Woodie | 1.18 | 1.59 | 1.88 | 2.29 | 2.58 | 2.99 | 3.28 |
| Fibonacci | 1.61 | 1.88 | 2.04 | 2.31 | 2.58 | 2.74 | 3.01 |
| Pivot points | S3 | S2 | S1 | PP | R1 | R2 | R3 |
|---|---|---|---|---|---|---|---|
| Standard | 1.27 | 1.74 | 2.09 | 2.56 | 2.91 | 3.38 | 3.73 |
| Camarilla | 2.21 | 2.28 | 2.36 | 2.43 | 2.51 | 2.58 | 2.66 |
| Woodie | 1.20 | 1.71 | 2.02 | 2.53 | 2.84 | 3.35 | 3.66 |
| Fibonacci | 1.74 | 2.06 | 2.25 | 2.56 | 2.88 | 3.07 | 3.38 |
Numerical data
The following is the status of technical indicators and moving averages registered at the time this technical analysis was created:
| RSI (14): | 52.69 | |
| MACD (12,26,9): | 0.0100 | |
| Directional Movement: | -6.80 | |
| AROON (14): | 35.71 | |
| DEMA (21): | 2.37 | |
| Parabolic SAR (0,02-0,02-0,2): | 2.30 | |
| Elder Ray (13): | -0.01 | |
| Super Trend (3,10): | 2.29 | |
| Zig ZAG (10): | 2.35 | |
| VORTEX (21): | 1.0900 | |
| Stochastique (14,3,5): | 58.58 | |
| TEMA (21): | 2.38 | |
| Williams %R (14): | -60.00 | |
| Chande Momentum Oscillator (20): | 0.02 | |
| Repulse (5,40,3): | -1.1600 | |
| ROCnROLL: | -1 | |
| TRIX (15,9): | 0.0900 | |
| Courbe Coppock: | 3.65 |
| MA7: | 2.33 | |
| MA20: | 2.44 | |
| MA50: | 2.60 | |
| MA100: | 2.44 | |
| MAexp7: | 2.36 | |
| MAexp20: | 2.35 | |
| MAexp50: | 2.34 | |
| MAexp100: | 2.34 | |
| Price / MA7: | +0.43% | |
| Price / MA20: | -4.10% | |
| Price / MA50: | -10.00% | |
| Price / MA100: | -4.10% | |
| Price / MAexp7: | -0.85% | |
| Price / MAexp20: | -0.43% | |
| Price / MAexp50: | -0% | |
| Price / MAexp100: | -0% |
About author

Online


Add a comment
Comments
0 comments on the analysis BTSE TOKEN - BTSE/USD - 1H