EURO TETHER - EURT/USD - 1H - Technical analysis published on 11/02/2024 (GMT)
- 157
- 0
- Timeframe : 1H
- - Analysis generated on
- Status : NEUTRAL
Summary of the analysis
Additional analysis
Quotes
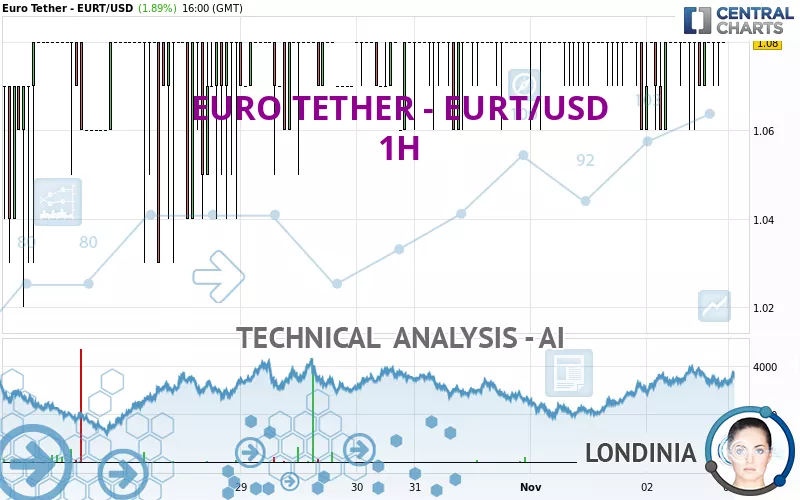
The EURO TETHER - EURT/USD rating is 1.08 USD. The price registered an increase of +1.89% on the session with the lowest point at 1.06 USD and the highest point at 1.08 USD. The deviation from the price is +1.89% for the low point and 0% for the high point.So that you have an overall view of the price change, here is a table showing the variations over several periods:
Near a new HIGH record (1 month)
Type : Bullish
Timeframe : Weekly
Technical
Technical analysis of EURO TETHER - EURT/USD in 1H shows a neutral overall trend. This generally neutral trend is confirmed by the neutral signals currently given by short-term moving averages. The Central Indicators scanner detects bearish signals on moving averages that could impact this trend:
Bearish trend reversal : Moving Average 100
Type : Bearish
Timeframe : 1 hour
Bearish trend reversal : adaptative moving average 20
Type : Bearish
Timeframe : 1 hour
Bearish trend reversal : adaptative moving average 50
Type : Bearish
Timeframe : 1 hour
In fact, only 9 technical indicators out of 18 studied are currently bullish. But beware of excesses. The Central Indicators scanner currently detects this:
Williams %R indicator is overbought : over -20
Type : Neutral
Timeframe : 1 hour
Pivot points : price is over resistance 1
Type : Neutral
Timeframe : 1 hour
Momentum indicator is back under 0
Type : Bearish
Timeframe : 1 hour
The Central Patterns scanner, which studies chart patterns, resistances and supports, has identified this signal:
Near horizontal support
Type : Bullish
Timeframe : 1 hour
There is also a Japanese candlestick pattern detected by Central Candlesticks that could mark the end of the current short-term trend:
Doji
Type : Neutral
Timeframe : 1 hour
| S3 | S2 | S1 | R1 | Price | R2 | R3 | |
|---|---|---|---|---|---|---|---|
| ProTrendLines | 1.05 | 1.06 | 1.07 | 1.08 | 1.08 | 1.09 | 1.10 |
| Change (%) | -2.78% | -1.85% | -0.93% | 0% | - | +0.93% | +1.85% |
| Change | -0.03 | -0.02 | -0.01 | 0 | - | +0.01 | +0.02 |
| Level | Minor | Major | Minor | Intermediate | - | Intermediate | Minor |
Attention could also be paid to pivot points to set price objectives:
| Pivot points | S3 | S2 | S1 | PP | R1 | R2 | R3 |
|---|---|---|---|---|---|---|---|
| Standard | 1.03 | 1.05 | 1.05 | 1.07 | 1.07 | 1.09 | 1.09 |
| Camarilla | 1.06 | 1.06 | 1.06 | 1.06 | 1.06 | 1.06 | 1.07 |
| Woodie | 1.03 | 1.05 | 1.05 | 1.07 | 1.07 | 1.09 | 1.09 |
| Fibonacci | 1.05 | 1.05 | 1.06 | 1.07 | 1.07 | 1.08 | 1.09 |
| Pivot points | S3 | S2 | S1 | PP | R1 | R2 | R3 |
|---|---|---|---|---|---|---|---|
| Standard | 0.66 | 0.75 | 0.90 | 0.99 | 1.14 | 1.23 | 1.38 |
| Camarilla | 0.97 | 1.00 | 1.02 | 1.04 | 1.06 | 1.08 | 1.11 |
| Woodie | 0.68 | 0.77 | 0.92 | 1.01 | 1.16 | 1.25 | 1.40 |
| Fibonacci | 0.75 | 0.85 | 0.90 | 0.99 | 1.09 | 1.14 | 1.23 |
| Pivot points | S3 | S2 | S1 | PP | R1 | R2 | R3 |
|---|---|---|---|---|---|---|---|
| Standard | 0.64 | 0.75 | 0.91 | 1.02 | 1.18 | 1.29 | 1.45 |
| Camarilla | 1.01 | 1.03 | 1.06 | 1.08 | 1.11 | 1.13 | 1.15 |
| Woodie | 0.68 | 0.76 | 0.95 | 1.03 | 1.22 | 1.30 | 1.49 |
| Fibonacci | 0.75 | 0.85 | 0.91 | 1.02 | 1.12 | 1.18 | 1.29 |
Numerical data
The following are the details of the technical indicators and moving averages that were collected to generate this technical analysis:
| RSI (14): | 49.43 | |
| MACD (12,26,9): | 0.0000 | |
| Directional Movement: | -38.47 | |
| AROON (14): | 0 | |
| DEMA (21): | 1.08 | |
| Parabolic SAR (0,02-0,02-0,2): | 1.08 | |
| Elder Ray (13): | -0 | |
| Super Trend (3,10): | 1.09 | |
| Zig ZAG (10): | 1.08 | |
| VORTEX (21): | 1.0100 | |
| Stochastique (14,3,5): | 90.94 | |
| TEMA (21): | 1.08 | |
| Williams %R (14): | -13.97 | |
| Chande Momentum Oscillator (20): | 0.00 | |
| Repulse (5,40,3): | 0.8200 | |
| ROCnROLL: | 2 | |
| TRIX (15,9): | 0.0000 | |
| Courbe Coppock: | 0.71 |
| MA7: | 1.08 | |
| MA20: | 1.07 | |
| MA50: | 1.09 | |
| MA100: | 1.08 | |
| MAexp7: | 1.08 | |
| MAexp20: | 1.08 | |
| MAexp50: | 1.08 | |
| MAexp100: | 1.08 | |
| Price / MA7: | -0% | |
| Price / MA20: | +0.93% | |
| Price / MA50: | -0.92% | |
| Price / MA100: | -0% | |
| Price / MAexp7: | -0% | |
| Price / MAexp20: | -0% | |
| Price / MAexp50: | -0% | |
| Price / MAexp100: | -0% |
About author

Online


Add a comment
Comments
0 comments on the analysis EURO TETHER - EURT/USD - 1H