| Open: | - |
| Change: | - |
| Volume: | - |
| Low: | - |
| High: | - |
| High / Low range: | - |
| Type: | Cryptocurrencies |
| Ticker: | EURTUSD |
| ISIN: |
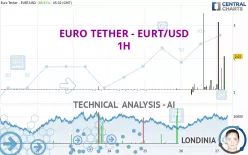
EURO TETHER - EURT/USD - 1H - Technical analysis published on 03/27/2024 (GMT)
- 160
- 0
- 03/27/2024 - 05:40
- Timeframe : 1H
- - Analysis generated on 03/27/2024 - 05:40
- Status : WITHOUT TARGET

Summary of the analysis
Additional analysis
Quotes
The EURO TETHER - EURT/USD price is 2.07 USD. The price has increased by +89.91% since the last closing with the lowest point at 1.08 USD and the highest point at 3.09 USD. The deviation from the price is +91.67% for the low point and -33.01% for the high point.The Central Gaps scanner detects a bearish opening marking the presence of sellers ahead of buyers at the opening but not sufficiently marked to allow the price to register a quotation gap.
Bearish opening
Type : Bearish
Timeframe : Openning
Here is a more detailed summary of the historical variations registered by EURO TETHER - EURT/USD:
Near a new HIGH record (5 years)
Type : Bullish
Timeframe : Weekly
The Central Volumes scanner notes the presence of abnormal volumes:
Abnormal volumes
Timeframe : 5 days
Abnormal volumes
Timeframe : 20 days
Abnormal volumes
Timeframe : 50 days
Technical
A technical analysis in 1H of this EURO TETHER - EURT/USD chart shows a bullish trend. 64.29% of the signals given by moving averages are bullish. This bullish trend shows slight signs of slowing down given the slightly bullish signals given by the short-term moving averages. The Central Indicators market scanner currently does not detect any result that concerns moving averages.
In fact, Central Analyzer took into account 18 technical indicators and the result was as follows: 4 are bullish, 9 are neutral and 5 are bearish. But beware of excesses. The Central Indicators scanner currently detects this:
Williams %R indicator is oversold : under -80
Type : Neutral
Timeframe : 1 hour
Momentum indicator is back over 0
Type : Bullish
Timeframe : 1 hour
Central Patterns, the scanner specializing in chart patterns, did not identify any signals.
From the Japanese candlestick perspective, the Central Candlesticks scanner notes the presence of these results that could impact the short-term trend:
White hanging man / hammer
Type : Neutral
Timeframe : 1 hour
Dragon-fly doji
Type : Bullish
Timeframe : 1 hour
Doji
Type : Neutral
Timeframe : 1 hour
| S3 | S2 | S1 | Price | |
|---|---|---|---|---|
| ProTrendLines | 1.19 | 1.25 | 1.36 | 2.07 |
| Change (%) | -42.51% | -39.61% | -34.30% | - |
| Change | -0.88 | -0.82 | -0.71 | - |
| Level | Minor | Minor | Minor | - |
To determine price objectives, it is also possible to use the pivot points. Here is the price position in relation to pivot points:
| Pivot points | S3 | S2 | S1 | PP | R1 | R2 | R3 |
|---|---|---|---|---|---|---|---|
| Standard | -2.24 | -0.66 | 0.21 | 1.79 | 2.66 | 4.24 | 5.11 |
| Camarilla | 0.42 | 0.64 | 0.87 | 1.09 | 1.32 | 1.54 | 1.76 |
| Woodie | -2.59 | -0.84 | -0.14 | 1.61 | 2.32 | 4.06 | 4.77 |
| Fibonacci | -0.66 | 0.27 | 0.85 | 1.79 | 2.72 | 3.30 | 4.24 |
| Pivot points | S3 | S2 | S1 | PP | R1 | R2 | R3 |
|---|---|---|---|---|---|---|---|
| Standard | 0.91 | 0.99 | 1.03 | 1.11 | 1.15 | 1.23 | 1.27 |
| Camarilla | 1.05 | 1.06 | 1.07 | 1.08 | 1.09 | 1.10 | 1.11 |
| Woodie | 0.90 | 0.98 | 1.02 | 1.10 | 1.14 | 1.22 | 1.26 |
| Fibonacci | 0.99 | 1.03 | 1.06 | 1.11 | 1.15 | 1.18 | 1.23 |
| Pivot points | S3 | S2 | S1 | PP | R1 | R2 | R3 |
|---|---|---|---|---|---|---|---|
| Standard | 0.99 | 1.01 | 1.05 | 1.07 | 1.11 | 1.13 | 1.17 |
| Camarilla | 1.06 | 1.07 | 1.08 | 1.08 | 1.09 | 1.09 | 1.10 |
| Woodie | 0.99 | 1.02 | 1.05 | 1.08 | 1.11 | 1.14 | 1.17 |
| Fibonacci | 1.01 | 1.04 | 1.05 | 1.07 | 1.10 | 1.11 | 1.13 |
Numerical data
The following is the status of the technical indicators and moving averages at the time of publication of this technical analysis:
| RSI (14): | 48.57 | |
| MACD (12,26,9): | 0.0000 | |
| Directional Movement: | 83.03 | |
| AROON (14): | -57.14 | |
| DEMA (21): | 1.11 | |
| Parabolic SAR (0,02-0,02-0,2): | 1.08 | |
| Elder Ray (13): | -0.03 | |
| Super Trend (3,10): | 1.65 | |
| Zig ZAG (10): | 1.08 | |
| VORTEX (21): | 0.9700 | |
| Stochastique (14,3,5): | 0.38 | |
| TEMA (21): | 1.10 | |
| Williams %R (14): | -99.52 | |
| Chande Momentum Oscillator (20): | 0.00 | |
| Repulse (5,40,3): | -64.6700 | |
| ROCnROLL: | 2 | |
| TRIX (15,9): | 0.1200 | |
| Courbe Coppock: | 2.75 |
| MA7: | 1.08 | |
| MA20: | 1.09 | |
| MA50: | 1.08 | |
| MA100: | 1.09 | |
| MAexp7: | 1.10 | |
| MAexp20: | 1.10 | |
| MAexp50: | 1.09 | |
| MAexp100: | 1.09 | |
| Price / MA7: | +91.67% | |
| Price / MA20: | +89.91% | |
| Price / MA50: | +91.67% | |
| Price / MA100: | +89.91% | |
| Price / MAexp7: | +88.18% | |
| Price / MAexp20: | +88.18% | |
| Price / MAexp50: | +89.91% | |
| Price / MAexp100: | +89.91% |
About author

Online


Add a comment
Comments
0 comments on the analysis EURO TETHER - EURT/USD - 1H