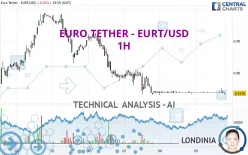
EURO TETHER - EURT/USD - 1H - Technical analysis published on 10/09/2022 (GMT)
- 185
- 0
Click here for a new analysis!
- Timeframe : 1H
- - Analysis generated on
- Status : LEVEL MAINTAINED

Summary of the analysis
Additional analysis
Quotes
The EURO TETHER - EURT/USD rating is 0.973600 USD. The price registered a decrease of -0.02% on the session and was between 0.973100 USD and 0.975100 USD. This implies that the price is at +0.05% from its lowest and at -0.15% from its highest.Here is a more detailed summary of the historical variations registered by EURO TETHER - EURT/USD:
Near a new LOW record (1 year)
Type : Bearish
Timeframe : Weekly
Near a new HIGH record (1 month)
Type : Bullish
Timeframe : Weekly
Technical
Technical analysis of this 1H chart of EURO TETHER - EURT/USD indicates that the overall trend is strongly bearish. 89.29% of the signals given by moving averages are bearish. This strongly bearish trend is showing signs of slowing down given the slightly bearish signals given by short-term moving averages. The Central Indicators market scanner currently does not detect any result that concerns moving averages.
An assessment of technical indicators does not currently provide any relevant information on the direction of future price movements.
But beware of excesses. The Central Indicators scanner currently detects this:
CCI indicator is oversold : under -100
Type : Neutral
Timeframe : 1 hour
MACD indicator: bullish divergence
Type : Bullish
Timeframe : 1 hour
Williams %R indicator is oversold : under -80
Type : Neutral
Timeframe : 1 hour
An analysis of the price chart with the Central Patterns scanner (detector of chart patterns and resistances and supports) shows several results that can have an impact on the price change:
Near horizontal support
Type : Bullish
Timeframe : 1 hour
Support of channel is broken
Type : Bearish
Timeframe : 1 hour
The presence of these Japanese chandelier patterns detected by Central Candlesticks that could impact the current short-term trend were also noted:
Bullish doji star
Type : Bullish
Timeframe : 1 hour
Black line without upper shadow
Type : Bearish
Timeframe : 1 hour
Long black line
Type : Bearish
Timeframe : 1 hour
| S1 | Price | R1 | R2 | R3 | |
|---|---|---|---|---|---|
| ProTrendLines | 0.959300 | 0.973600 | 0.973933 | 0.979509 | 0.982900 |
| Change (%) | -1.47% | - | +0.03% | +0.61% | +0.96% |
| Change | -0.014300 | - | +0.000333 | +0.005909 | +0.009300 |
| Level | Intermediate | - | Intermediate | Major | Minor |
Pivot points can also be used to set your price objectives. Here is the price situation in relation to pivot points:
| Pivot points | S3 | S2 | S1 | PP | R1 | R2 | R3 |
|---|---|---|---|---|---|---|---|
| Standard | 0.971533 | 0.972267 | 0.973033 | 0.973767 | 0.974533 | 0.975267 | 0.976033 |
| Camarilla | 0.973388 | 0.973525 | 0.973663 | 0.973800 | 0.973938 | 0.974075 | 0.974213 |
| Woodie | 0.971550 | 0.972275 | 0.973050 | 0.973775 | 0.974550 | 0.975275 | 0.976050 |
| Fibonacci | 0.972267 | 0.972840 | 0.973194 | 0.973767 | 0.974340 | 0.974694 | 0.975267 |
| Pivot points | S3 | S2 | S1 | PP | R1 | R2 | R3 |
|---|---|---|---|---|---|---|---|
| Standard | 0.939267 | 0.956133 | 0.964967 | 0.981833 | 0.990667 | 1.007533 | 1.016367 |
| Camarilla | 0.966733 | 0.969088 | 0.971444 | 0.973800 | 0.976156 | 0.978512 | 0.980868 |
| Woodie | 0.935250 | 0.954125 | 0.960950 | 0.979825 | 0.986650 | 1.005525 | 1.012350 |
| Fibonacci | 0.956133 | 0.965951 | 0.972016 | 0.981833 | 0.991651 | 0.997716 | 1.007533 |
| Pivot points | S3 | S2 | S1 | PP | R1 | R2 | R3 |
|---|---|---|---|---|---|---|---|
| Standard | 0.884533 | 0.919167 | 0.949733 | 0.984367 | 1.014933 | 1.049567 | 1.080133 |
| Camarilla | 0.962370 | 0.968347 | 0.974323 | 0.980300 | 0.986277 | 0.992253 | 0.998230 |
| Woodie | 0.882500 | 0.918150 | 0.947700 | 0.983350 | 1.012900 | 1.048550 | 1.078100 |
| Fibonacci | 0.919167 | 0.944073 | 0.959460 | 0.984367 | 1.009273 | 1.024660 | 1.049567 |
Numerical data
The following are the details of the technical indicators and moving averages that were collected to generate this technical analysis:
| RSI (14): | 40.42 | |
| MACD (12,26,9): | -0.0001 | |
| Directional Movement: | 26.302058 | |
| AROON (14): | -7.142857 | |
| DEMA (21): | 0.973624 | |
| Parabolic SAR (0,02-0,02-0,2): | 0.973353 | |
| Elder Ray (13): | 0.000174 | |
| Super Trend (3,10): | 0.974109 | |
| Zig ZAG (10): | 0.973800 | |
| VORTEX (21): | 1.0938 | |
| Stochastique (14,3,5): | 4.95 | |
| TEMA (21): | 0.973934 | |
| Williams %R (14): | -100.00 | |
| Chande Momentum Oscillator (20): | -0.000300 | |
| Repulse (5,40,3): | -0.0801 | |
| ROCnROLL: | 2 | |
| TRIX (15,9): | -0.0021 | |
| Courbe Coppock: | 0.01 |
| MA7: | 0.981500 | |
| MA20: | 0.977555 | |
| MA50: | 0.990352 | |
| MA100: | 1.003966 | |
| MAexp7: | 0.973766 | |
| MAexp20: | 0.973868 | |
| MAexp50: | 0.974996 | |
| MAexp100: | 0.977462 | |
| Price / MA7: | -0.80% | |
| Price / MA20: | -0.40% | |
| Price / MA50: | -1.69% | |
| Price / MA100: | -3.02% | |
| Price / MAexp7: | -0.02% | |
| Price / MAexp20: | -0.03% | |
| Price / MAexp50: | -0.14% | |
| Price / MAexp100: | -0.40% |
About author

Online


Add a comment
Comments
0 comments on the analysis EURO TETHER - EURT/USD - 1H